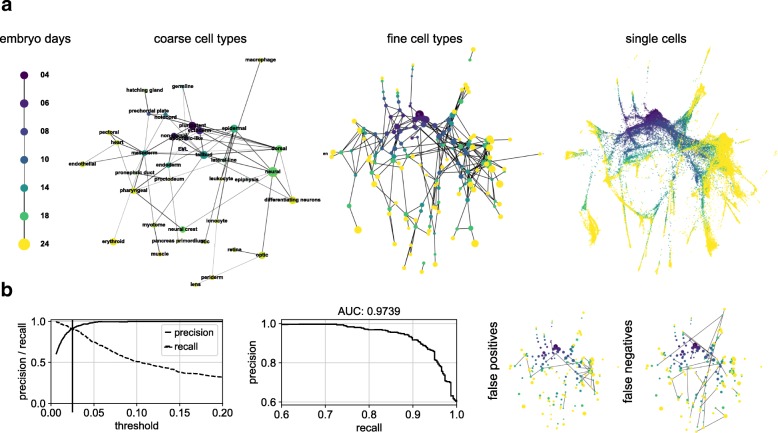
Fig. 4.
PAGA applied to zebrafish embryo data of Wagner et al. [30]. a PAGA graphs obtained after running PAGA on partitions corresponding to embryo days, coarse cell types, more fine-grained cell types, and a PAGA-initialized single-cell embedding. Cell type assignments are from the original publication. b Performance measurements of the PAGA prediction compared to the reference graph of Wagner et al. show high accuracy. False-positive edges and false-negative edges for the threshold indicated by a vertical line in the left panel are also shown

