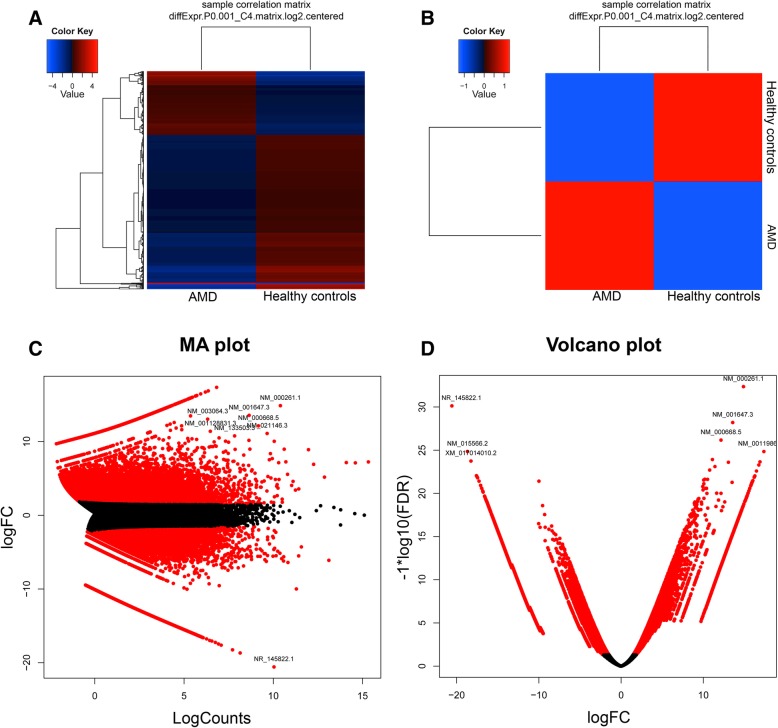
Fig. 2.
Graphical representation of differentially expressed genes. a Significantly up- and downregulated genes were represented as a heat map (red color shows upregulated and blue color shows downregulated genes. b Significantly up- and the downregulated gene was represented as a matrix correlation plot c MA plot represented by significantly up- and downregulated gene based on the logFC and logCounts. d Volcano plot represented by significantly up- and downregulated gene based on the logFC and log10 (FDR)

