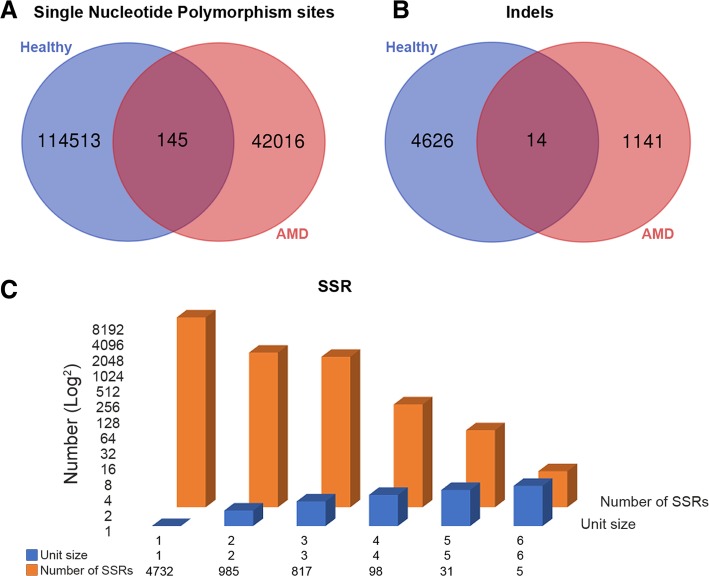
Fig. 5.
Comparisons of control vs. human AMD of the differentially expressed genes of SNPs and Indels were illustrated by Venn diagrams. a The Venn diagram is represented SNPs of differential expressed genes in control vs. human AMD. b The Venn diagram is represented Indels of differential expressed genes in control vs. human AMD. c The simple sequence repeats (SSRs) of differential expressed genes represented by bar diagram in human AMD

