Fig. 2.
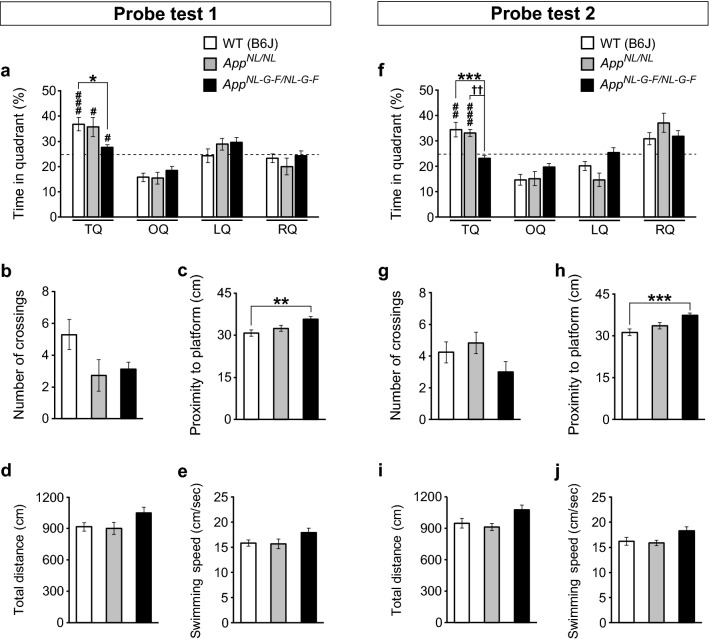
Spatial memory in AppNL-G-F/NL-G-F and AppNL/NL mice during probe tests in the Morris water maze task. a In Probe test 1, AppNL-G-F/NL-G-F mice spent less time in the target quadrant than WT mice. All genotypes spent significantly higher percentages of time in the target quadrant than predicted by chance (25%, as indicated by dotted lines). b The number of platform crossings did not differ among genotypes. c AppNL-G-F/NL-G-F mice exhibited significantly longer proximity to the platform than WT mice. d and e The total distance travelled and swimming speed in Probe test 1 were similar among genotypes. f In Probe test 2, the percentage of time spent in the target quadrant was significantly lower in AppNL-G-F/NL-G-F mice than in WT mice. The percentage of time spent in the target quadrant by AppNL-G-F/NL-G-F mice was comparable to the chance level (25%). g The number of platform crossings during the test did not differ among genotypes. h The proximity to the platform was significantly higher in AppNL-G-F/NL-G-F mice. i and j Total distance travelled and swimming speed were comparable among genotypes. a–j AppNL/NL mice had normal memory function at 1 and 7 days after the last training session. n = 17 WT (B6J), n = 11 AppNL/NL, n = 16 AppNL-G-F/NL-G-F. *p < 0.05, **p < 0.01, ***p < 0.001, versus WT (B6J). ††p < 0.01, versus AppNL/NL. ♯p < 0.05, ♯♯p < 0.01, ♯♯♯p < 0.001, versus chance level

