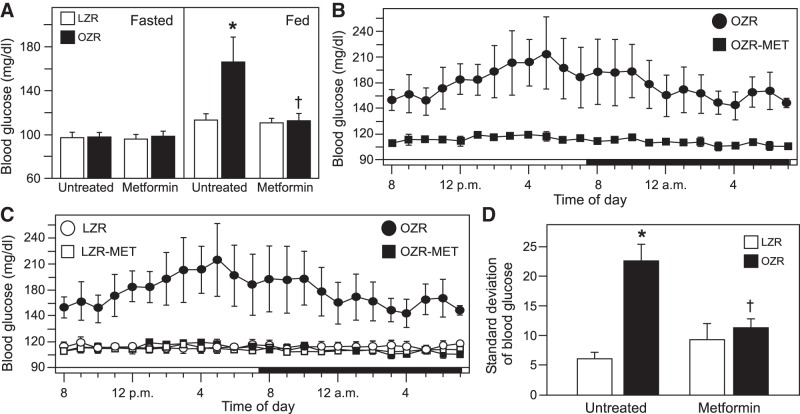
Fig. 3.
Baseline blood glucose values measured by telemetry in untreated and metformin (MET)-treated lean Zucker rats (LZR) and obese Zucker rats (OZR) at 15–17 wk of age. Data are from the same rats from Figs. 1 and 2 with each group divided into untreated rats (5 LZR and 5 OZR) and metformin-treated rats (6 LZR and 6 OZR). A: morning blood glucose levels in untreated and metformin-treated rats during fasted (left) and fed (right) states. Data were analyzed separately within the same feeding status by ANOVA with Tukey’s honestly significant difference (HSD) tests; *P < 0.05 vs. untreated fed LZR and †P < 0.05 vs. untreated fed OZR. B: hourly glucose values from untreated and metformin-treated OZR over a 24-h period analyzed by ANOVA with repeated measures and Tukey’s HSD tests; P < 0.05 for untreated and metformin-treated OZR for all hours. C: hourly glucose values over a 24-h period from untreated and metformin-treated LZR and OZR (same OZR as in B). ANOVA with repeated measures for metformin-treated LZR and OZR and ANOVA for untreated and metformin-treated LZR did not yield significant differences. D: standard deviation of blood glucose values over a 24-h period with access to food. Data were analyzed by ANOVA with Tukey’s HSD tests; *P < 0.05 vs. untreated LZR and †P < 0.05 vs. untreated OZR.

