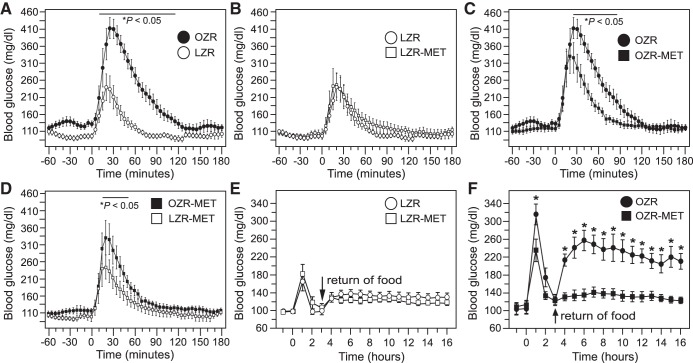
Fig. 4.
Glucose tolerance tests in untreated and metformin (MET)-treated lean Zucker rats (LZR) and obese Zucker rats (OZR) at 15−17 wk of age. See Table 2 and Fig. 3 for baseline values of these rats. A–D: blood glucose levels measured by telemetry before and after injection of glucose (at time 0), shown in pairs of groups for clarity. Each pair was analyzed by ANOVA with repeated measures with Tukey’s honestly significance difference (HSD) tests. *P < 0.05 differs at that time point. E: same glucose tolerance test in LZR from B with blood glucose measured in hourly averages and return of food at hour 3. F: same glucose tolerance test in OZR from C with blood glucose measured in hourly averages and return of food at hour 3. For E and F, the data were analyzed by ANOVA with repeated measures with Tukey’s HSD tests; *P < 0.05 vs. metformin-treated OZR at that time point.

