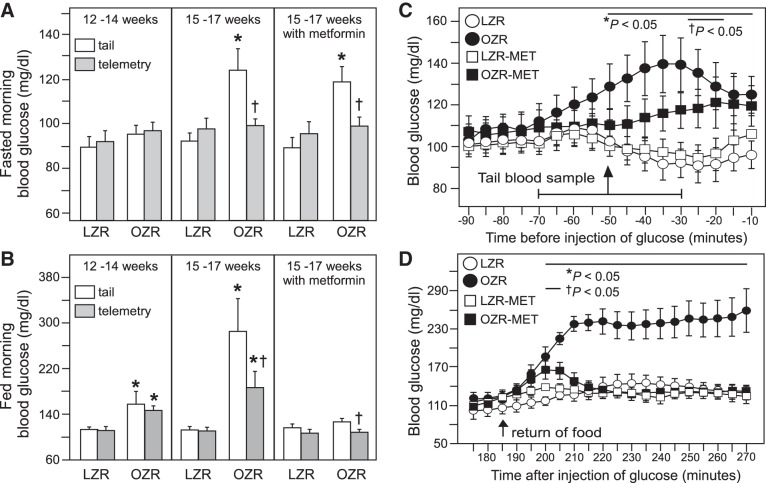
Fig. 5.
Development of enhanced reactivity to tail sampling of blood glucose in obese Zucker rats (OZR) at 15–17 wk of age. Comparisons of fasted (A) and fed (B) blood glucose values from morning tail samples and telemetry values 1 h before the tail samples in OZR (n = 12) and lean Zucker rats (LZR) (n = 11) at 12–14 wk of age (left), in OZR (n = 6) and LZR (n = 6) at 15–17 wk of age (middle), and in OZR (n = 6) and LZR (n = 6) at 15–17 wk of age after metformin treatment (right). Each of the three sets was analyzed by ANOVA with repeated measures for sample type with Tukey’s honestly significant difference (HSD) tests. *P < 0.05 vs. tail sample in LZR and †P < 0.05 vs. tail sample in OZR. Enlargement of data shown in Fig. 4, A and D, with a tail sample taken ~1 h before injection of glucose at time 0 (C). The arrow denotes the mean time of all tail samples (51 min) with a horizontal line to denote the range of times a baseline tail sample was taken (−30 to −70 min). Like-treated rats were compared by ANOVA with repeated measures with Tukey’s HSD tests. *P < 0.05 vs. untreated LZR and †P < 0.05 vs. metformin (MET)-treated LZR. Expansion of data shown in Fig. 4, E and F, to show 5-min averages over the time period of 95 min to 270 min (3 h) after injection of glucose (D). Like-treated rats were compared by ANOVA with repeated measures with Tukey’s HSD tests. *P < 0.05 vs. untreated LZR (circles) during that time period and †P < 0.05 vs. metformin-treated LZR (squares) during that time period.

