
Fig. 2.
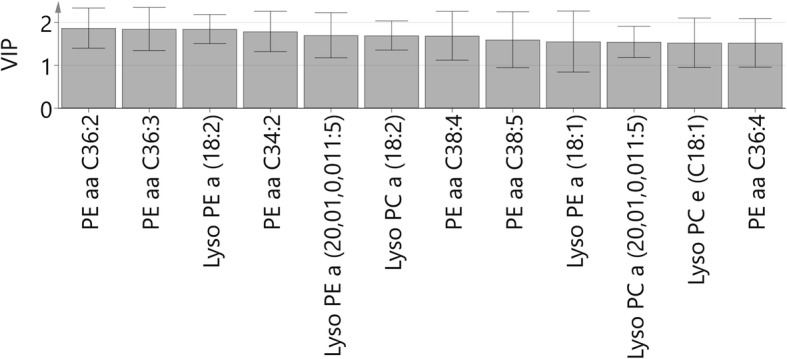
Phospholipid responses to food intake. Variable importance of projection (VIP) values, based on orthogonal partial least-squares effect projection (OPLS-EP) analysis (4-h time point minus fasting) of the phospholipid dataset. Values are displayed as VIP and confidence interval (CI). Discriminant phospholipids adding significant structure to the model (VIP > 1.5) and for which the corresponding jackknife-based 95% CIs were not close to or including zero are displayed