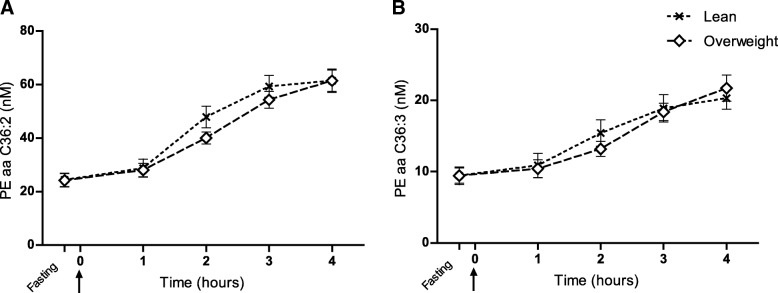
Fig. 3.
Phospholipid responses to food intake in lean and overweight dogs. (a and b) Fasting plasma samples were taken 15 min before serving a test meal at time 0 (arrow) and phospholipid concentrations in lean (BCS 4–5, n = 12) and overweight (BCS 6–8, n = 16) dogs are shown as response curves from fasting to 4 h after feeding. Mixed model repeated measures analyses were applied and showed increasing responses to food intake (overall significant for both between time points, P < 0.0001), but no differences between body condition groups. Values are given as nM concentrations (mean ± SEM). PEaa C36:2; phosphatidylethanolamine with 36 carbons, two ester bonds (aa) and two double bonds. PCaa C36:3; phosphatidylethanolamine with 36 carbons, two ester bonds and three double bonds. Note: A and B were the most discriminant phospholipids over time between fasting and the 4-h postprandial time point according to variable importance of projection analysis (VIP) in Fig. 2

