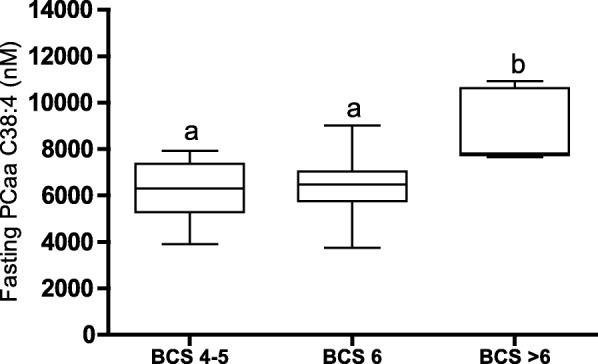
Fig. 4.

Differences in fasting phosphatidylcholine (PCaa C38:4) concentrations between body condition groups. Dogs were given a clinical body condition score (BCS 4–8 on a 9-point scale, n = 28), and were then divided into three body condition groups based on linear regression analysis (see Results section). One-way ANOVA (P = 0.003) was performed and differences in fasting PCaa C38:4 (nM) concentrations between lean (BCS 4–5, n = 12), slightly overweight (BCS 6, n = 10) and prominently overweight dogs (BCS > 6, n = 6) are shown as a box plot (median fasting values, 25–75% percentile, whiskers min. to max.). Different letters (a and b) indicate body condition groups that differed significantly (P < 0.05)
