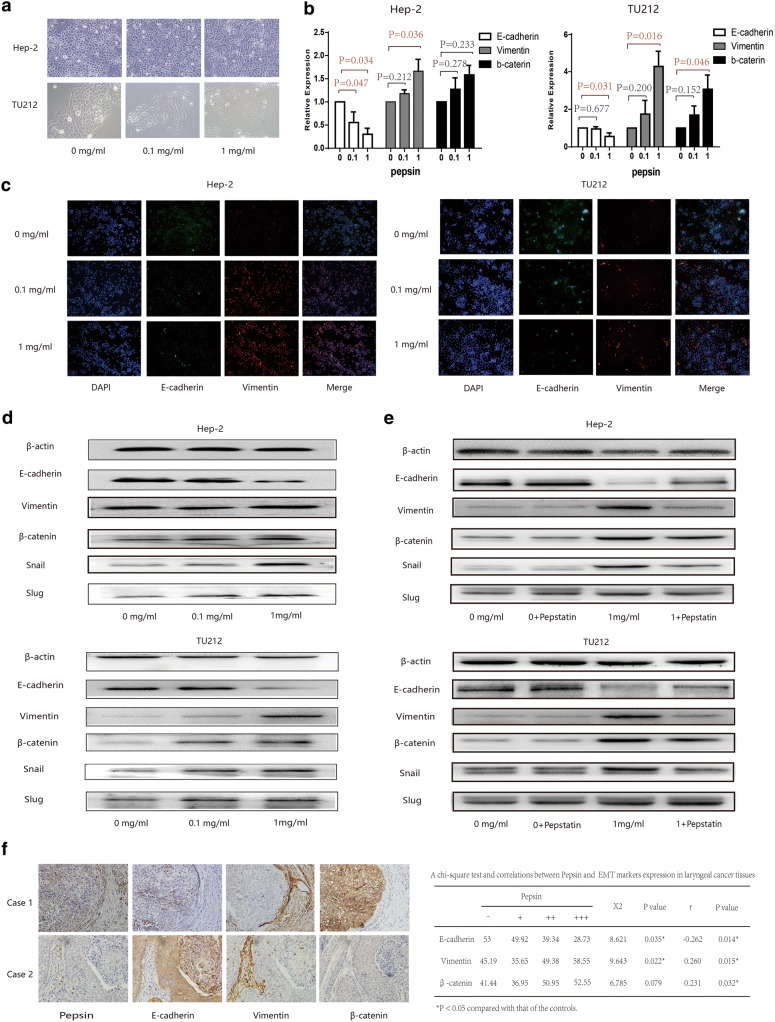
Fig. 3.
Expression of epithelial and mesenchymal markers in Hep-2 and Tu212 cells treated with pepsin. a Morphology of Hep-2 and Tu212 cells exposed to different pepsin concentrations is shown using phase contrast microscopy. b Expression levels of E-cadherin, vimentin, and β-catenin in Hep-2 and Tu212 cells exposed to different concentrations of pepsin analyzed using quantitative real-time PCR. c Effect of different pepsin concentrations on the expression of E-cadherin and vimentin in Hep-2 and Tu212 cells immunostained and analyzed using confocal microscopy (magnification, ×200). d Expression of E-cadherin, vimentin, β-catenin, snail, and slug in Hep-2 and Tu212 cells exposed to different concentrations of pepsin analyzed using western blotting. e Expression of E-cadherin, vimentin, β-catenin, snail, and slug in Hep-2 and Tu212 cells exposed to pepsin with/without pepstatin analyzed using western blotting. f Representative photomicrographs illustrating the immunohistochemical analyses for pepsin, E-cadherin, vimentin, and β-catenin in tissue specimens from two patients with laryngeal carcinoma (magnification, ×400). *P < 0.05 compared to that of the controls

