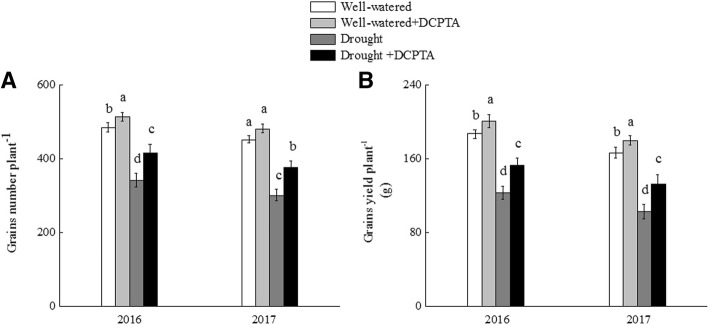
Fig. 1.
Changes in the grain number plant−1 (a) and grain yield plant− 1 (g) (b) of maize in 2016 and 2017. The data represent the means of independent measurements with five replicates, and the standard deviations are indicated by the vertical error bars. Values with the same letters on the bars are not significantly different at P < 0.05 (LSD test)

