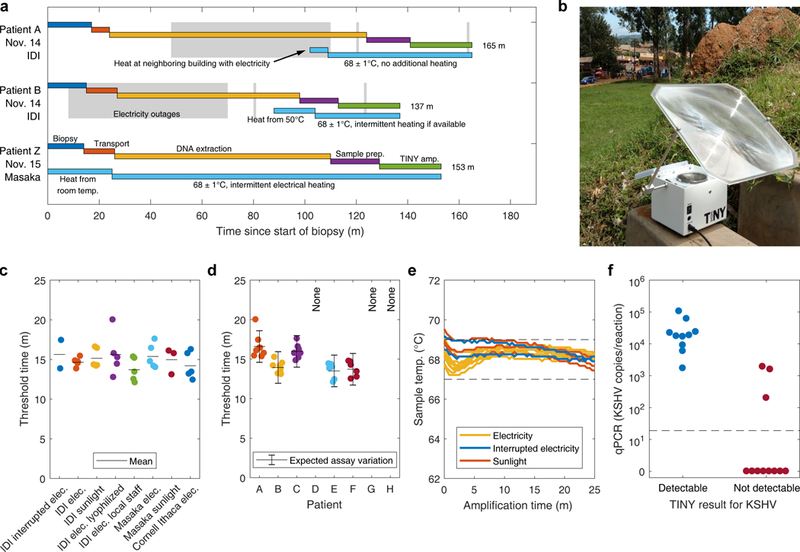
Fig. 7. Analysis of human samples by TINY in Uganda.

(a) Detailed timeline from biopsy to TINY result, for 3 patients. Gray boxes show when electricity outages were experienced. Light blue boxes detail how TINY was heated before LAMP. (b) TINY being heated with sunlight at the Uganda Cares Clinic in Masaka, Uganda. (c) Threshold times of 8 human samples (target: KSHV DNA) when analyzed at a variety of locations and via different heating conditions or operating procedures. Horizontal lines are the mean. (d) The threshold times of the same 8 human samples from (c) but grouped by patient. Some patients were not analyzed for all scenarios due to experimental limitations (see Table 1). Plotted: mean ± the expected variation of the LAMP assay (calculated using the upper adjacent value from Fig. 6c: 1.04 orders of magnitude in copies/reaction, or 2.00 minutes when converted to time using the slope of the standard curve). Patient Z from (a) is not included as that sample was obtained after many conditions were tested. (e) Temperature profiles inside TINY during LAMP from (a) through (d), with color indicating the heating method. Data are from ten, two, and three experiments in TINY when heated by stable electricity, interrupted electricity, and sunlight, respectively. Dashed lines: target temperature (68 ± 1°C). (f) The true KSHV DNA concentration of 21 patient samples, grouped by TINY result. Specimens were independently tested in TINY by the Ugandan team at the IDI four months after the field trial (TINY heated by electricity). Those samples producing threshold times < 24 minutes were considered detectable by TINY. Samples reported as 0 copies/reaction by qPCR were below the qPCR limit of detection (shown by the dashed line: about 19 copies/reaction).
