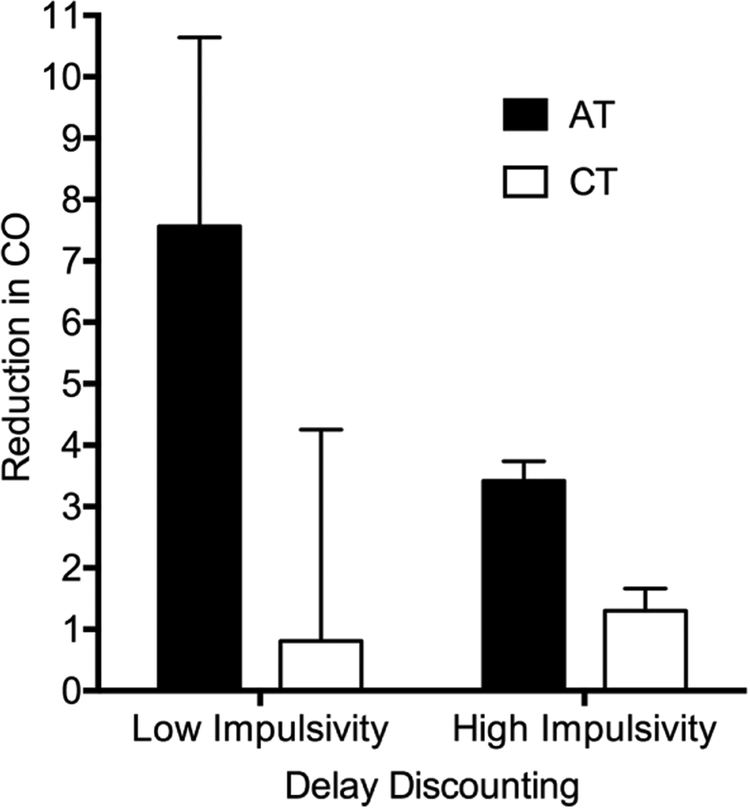
Figure 2. Change in carbon monoxide from Baseline to Return-to-Baseline phases.
Reduction in CO from Baseline to Return-to-Baseline phases. AT = Active Treatment; CT = Control Treatment. Values are mean change in CO (95% CI denoted by error bars) based on parameter estimates derived from a multiple regression model using average values for covariates of age, Fagerstrom Test for Nicotine Dependence, Stage-of-Change Ladder score, and averaged across sexes and studies. Reduction was calculated for −1 SD (High Impulsive behavior; right bars) and +1 SD (Low Impulsive behavior; left bars) pre-treatment delay discounting score.

