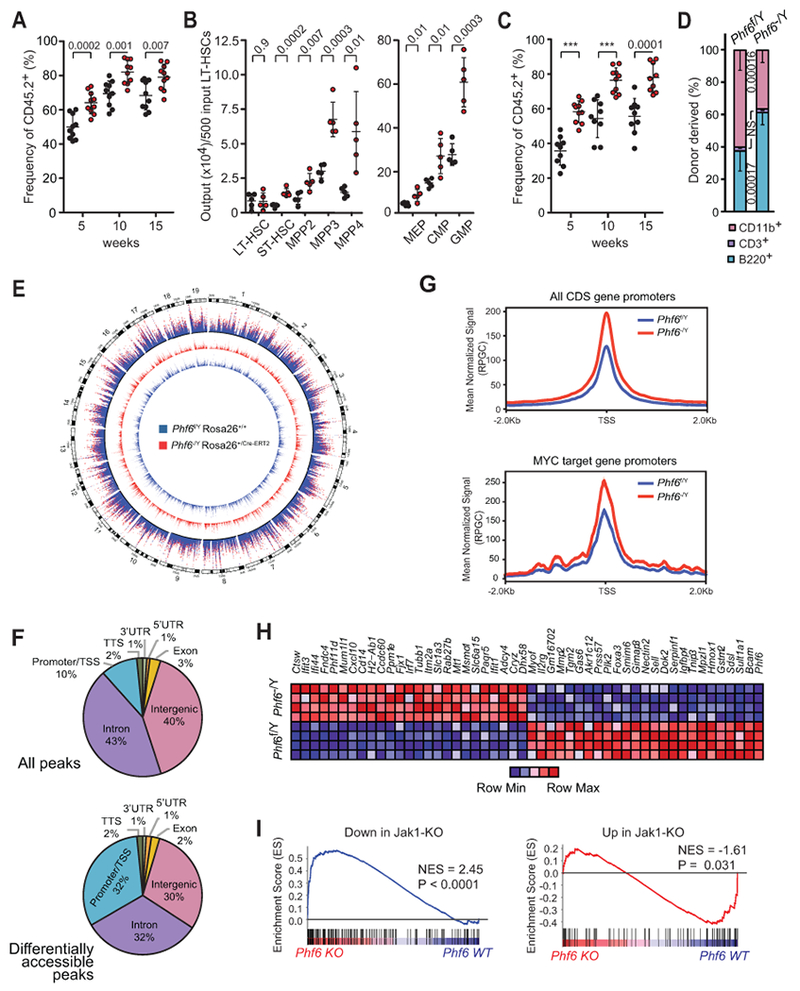
Figure 3.

Phf6 deletion in adult LT-HSCs increases hematopoietic repopulation capacity associated with increased chromatin accessibility and transcriptional upregulation of JAK-STAT signature genes. A, Frequency of total donor-derived cells in peripheral blood 5, 10 and 15 weeks after transplantation of 500 LT-HSCs sorted from Phf6 wild-type (Phf6f/Y Rosa26+/+) or Phf6 knockout (Phf6−/Y Rosa26+/Cre-ERT2) donor mice (n = 10 recipients per group). B, The absolute number of hematopoietic stem and progenitor cells (LT- and ST-HSCs, MPP2-4) and myeloid-restricted progenitor cells (MEP, CMP, GMP) derived from 500 Phf6 wild-type or Phf6 knockout sorted LT-HSCs in the bone marrow of recipient mice16 weeks after transplantations (n = 5 per group), as in A. C, Frequency of total donor-derived reconstitution in peripheral blood after secondary transplantation of 1000 re-sorted Phf6 wild-type or Phf6 knockout LT-HSCs (n = 10 per group). D, Relative distribution of B cell (B220+), T cell (CD3+) and myeloid (CD11b+) populations in peripheral blood 15 weeks post-transplant, as in C. Values are shown for individual mice. Graphs represent mean ± standard deviation. P values were calculated using two-tailed Student’s t-test. *** indicates P < 0.0001. E, Genome-wide distribution of normalized chromatin accessibility in Phf6 knockout LT-HSCs (red track) and wild-type (blue track) LT-HSCs shown separately and in overlay (outer track). F, Distribution of ATACseq peaks, and of significantly differentially accessible peaks in Phf6 knockout compared to wild-type LT-HSCs. G, Normalized average ATAC-Seq signal across all protein-coding transcript promoters (top) and MYC target genes (DANG_MYC_TARGETS_UP, C2 MSIG M6506) centered on the TSS (Transcription Start Site). H, Heatmap representation of top differentially expressed genes in Phf6 knockout compared with Phf6 wild-type LT-HSCs. I, Gene set enrichment plots from GSEA of a Jak1-loss signature comprised by genes differentially expressed in LT-HSCs of Jak1 knockout mice tested in Phf6 knockout LT-HSCs. Genes that display decreased expression in Jak1 knockout LT-HSCs were tested separately (left) from those that show increased expression (right). Normalized enrichment score (NES) and the FEWER p-value are shown.
