Figure 5.

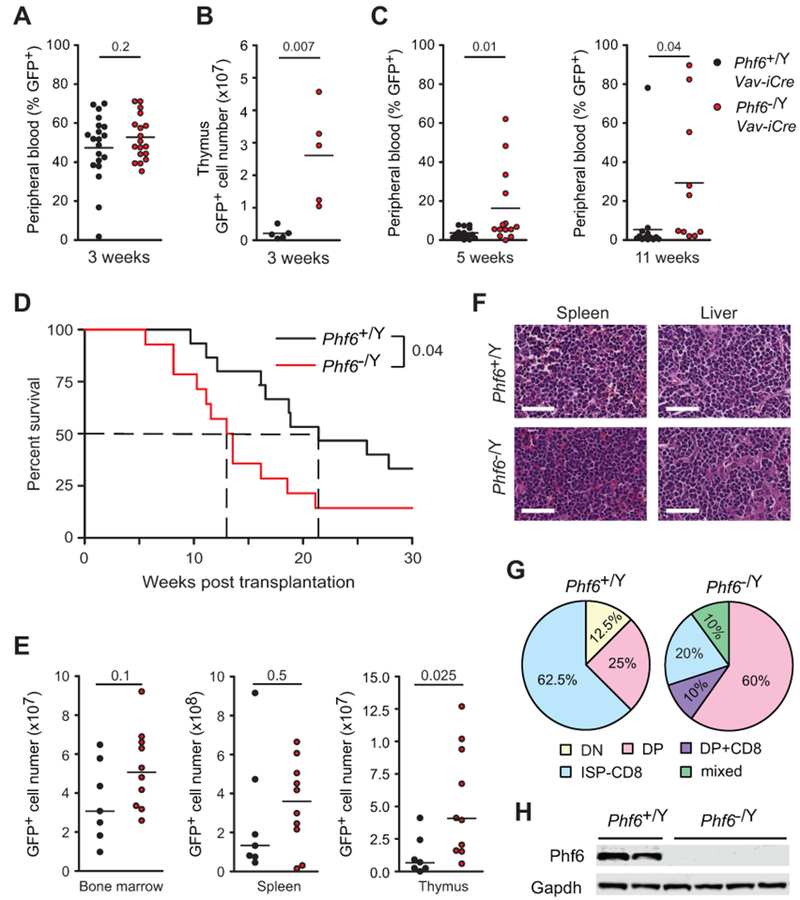
Loss of Phf6 enhances NOTCH1-induced T-ALL development. A, Peripheral blood quantification of GFP+ cells in mice transplanted with NOTCH1-L1601P-ΔPEST-transduced Phf6 wild-type (Phf6+/Y Vav-iCre) (n = 20) and Phf6 knockout (Phf6−/Y Vav-iCre) (n = 19) bone marrow progenitors showing transient NOTCH1-driven preleukemic T-cell expansion 3 weeks post-transplant. B, Quantification of GFP+ preleukemia cell infiltration in the thymus of mice 3 weeks after transplantation with NOTCH1 L1601P-ΔPEST-transduced Phf6 wild-type and Phf6 knockout (n = 5 per group) bone marrow progenitors. C, Peripheral blood analysis of early (5 weeks) and late (11 weeks) leukemia development detected by circulating GFP+ leukemia cells in mice transplanted with NOTCH1-L1601P-ΔPEST-transduced Phf6 wild-type and Phf6 knockout bone marrow progenitors. D, Kaplan-Meier survival curves of mice harboring Phf6 wild-type (Phf6+/Y Vav-iCre; n = 14) and Phf6 knockout (Phf6−/Y Vav-iCre; n = 14) NOTCH1-induced leukemias, as in C. E, Flow cytometry quantification of leukemia infiltration in bone marrow, spleen and thymus of Phf6 wild-type and Phf6 knockout NOTCH1-induced leukemia-bearing mice at endpoint. F, Representative micrographs of histology analysis of Phf6 wild-type and Phf6 knockout NOTCH1-induced leukemias. G, Phenotypic categorization of Phf6 wild-type and Phf6 knockout NOTCH1-induced leukemias based on CD4 and CD8 surface expression analyzed by flow cytometry. H, Western blot analysis of Phf6 expression in Phf6 wild-type and Phf6 knockout NOTCH1-induced leukemia lymphoblasts. P values in A-C and E were calculated using two-tailed Student’s t-test. P values in D were calculated using the log-rank test. Scale bars in F, 50 μm.
