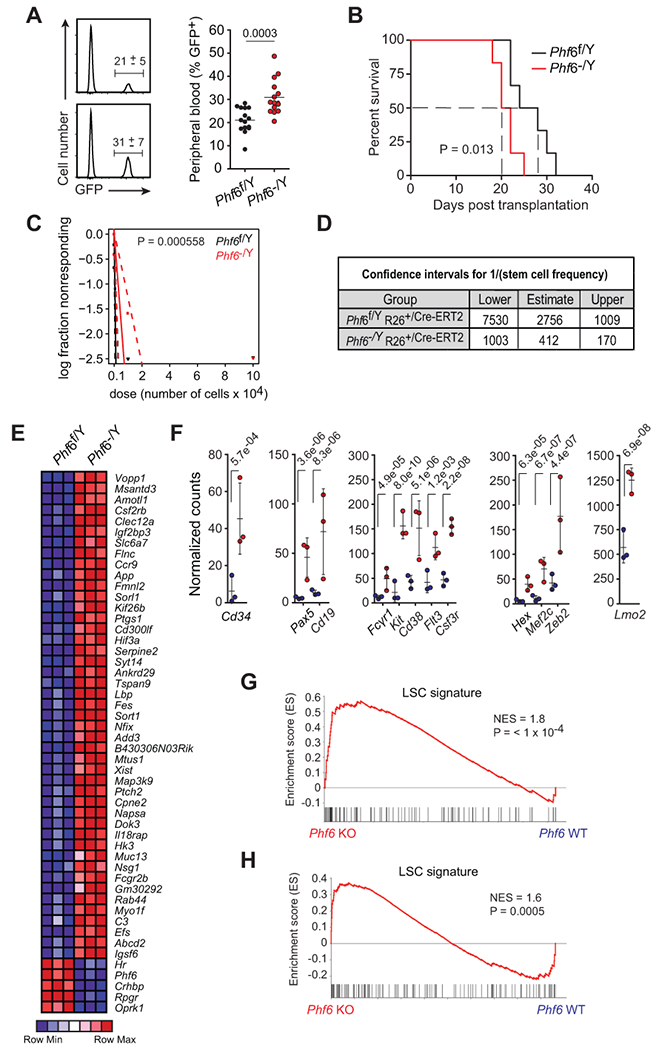
Figure 6.

Loss of Phf6 activates an LIC program and increases LIC frequency in T-ALL. A, Quantification of GFP+ leukemia cells in peripheral blood of mice engrafted with Phf6f/Y Rosa26+/Cre-ERT2 wild-type and isogenic Phf6−/Y Rosa26+/Cre-ERT2 knockout leukemia cells on day 15 after transplantation (n = 15 per group). B, Kaplan-Meier survival curves of mice harboring Phf6 wild-type and isogenic Phf6 knockout NOTCH1-induced leukemias (n = 10 per group), as in A. C, Leukemia-initiating cell (LIC) analysis in mice transplanted with Phf6f/Y Rosa26+/Cre-ERT2 wild-type and isogenic Phf6−/Y Rosa26+/Cre-ERT2 knockout leukemia cells (n = 6 per group). D, Confidence intervals showing 1/ (stem cell frequency) based on C. E, Heatmap representation of relative gene expression for top 50 ranking genes differentially expressed between Phf6f/Y Rosa26+/Cre-ERT2 wild-type and isogenic Phf6−/Y Rosa26+/Cre-ERT2 knockout NOTCH1-induced leukemia cells. F, Normalized gene expression of selected genes differentially expressed between isogenic wild-type and Phf6 knockout NOTCH1-induced leukemia cells. G, GSEA analysis depicting enrichment of LSC-signature genes in the expression signature associated with Phf6−/Y Rosa26+/Cre-ERT2 knockout NOTCH1-induced leukemia lymphoblast cells compared with Phf6f/Y Rosa26+/Cre-ERT2 wild-type isogenic controls. H, GSEA analysis depicting enrichment of LSC-signature genes in the expression signature associated with human PHF6 mutant T-ALL compared with matched PHF6 wild-type controls. Graphs in A depict measurements from individual mice with mean and standard deviation. P values were calculated using two-tailed Student’s t-test in A, the log-rank test in C, and using the Chi-square test in D.
