FIG 6.
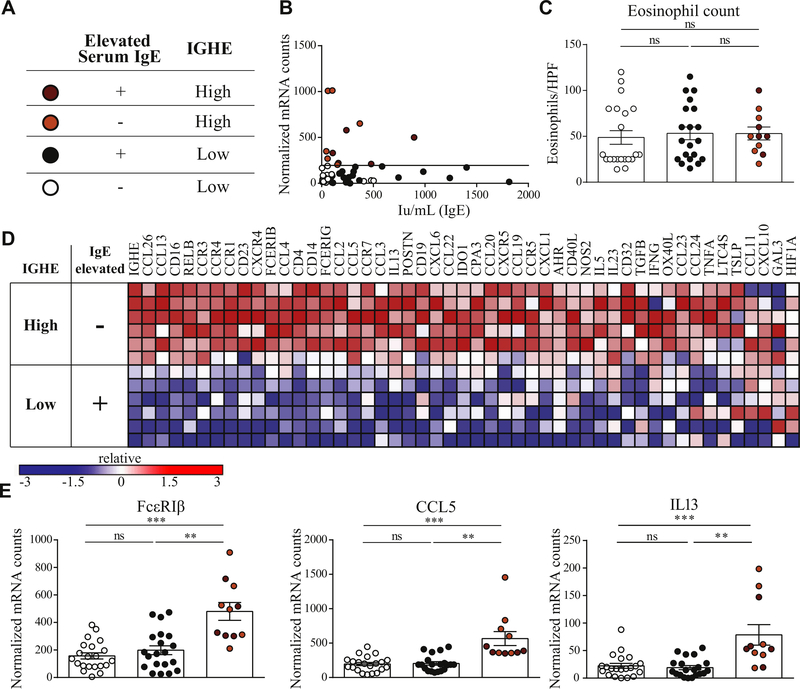
Serum IgE, esophageal IGHE transcript levels and local TH2-type inflammation. A, Patient key. B, Correlation of serum IgE titers and esophageal IGHE transcript levels. Separation of EoE patients based on serum IgE and IGHE. C, Eosinophil counts in IGHE-low (white circles: normal serum IgE; black circles: elevated IgE) and IGHE-high patients (orange circles: normal IgE; red circles: elevated IgE). D, Representative heat map of patients from the IGHE-high/serum-IgE-normal and IGHE-low/serum-IgE-elevated. Only the most enriched genes are shown. E, Representative transcripts: FcεRIβ, CCL5, and IL-13. **P < .01, ***P < .001, as calculated by Dunn multiple comparison test after Kruskal-Wallis test.

