Figure 6.
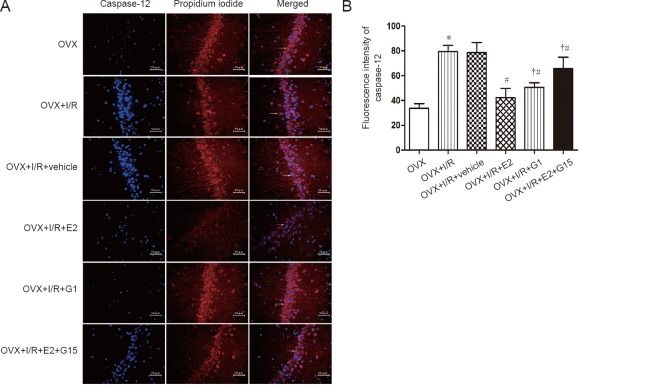
E2 and G1 reduce expression and distribution of caspase-12 in the hippocampal CA1 region after I/R.
(A) Representative images of caspase-12 immunofluorescence. Blue: caspase-12; red: propidium iodide; fluorescent agent: FITC-conjugated anti-rabbit secondary antibody. Arrows indicate positive cells. Original magnification: 200×. Scale bar: 50 µm. (B) Fluorescence intensity of caspase-12. Data are expressed as the mean ± SEM (n = 6; one-way analysis of variance followed by Student-Newman-Keuls post hoc test). *P < 0.05, vs. OVX group; #P < 0.05, vs. OVX + I/R group; †P < 0.05, vs. OVX + I/R + E2 group. E2: 17-β-estradiol; G1: selective GPER agonist; G15: selective GPER inhibitor; I/R: ischemia/reperfusion; OVX: ovariectomized.

