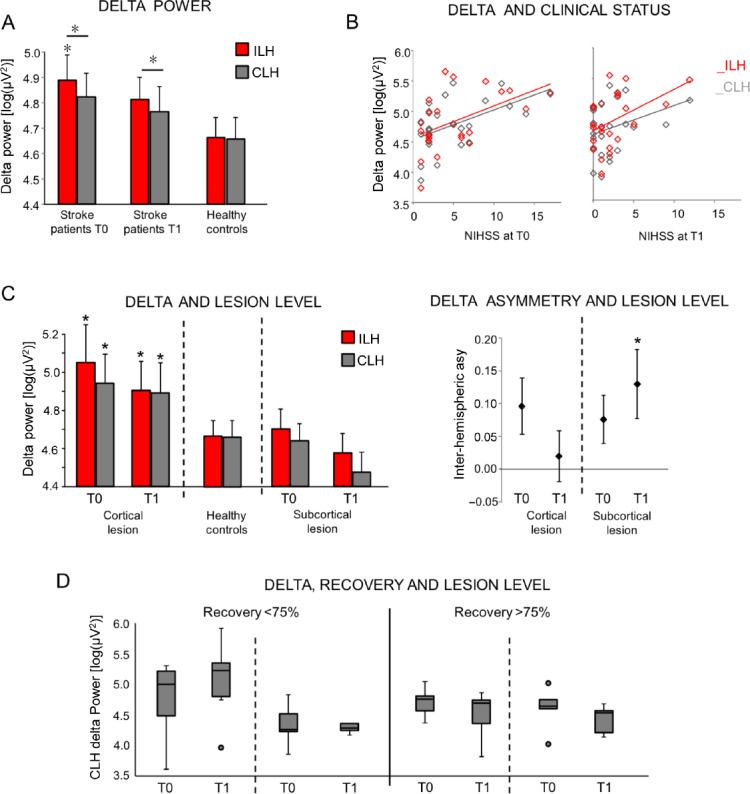
Figure 3.

Electroencephalographic delta band power.
(A) Mean (standard error) of band power values in delta band for ILH and CLH in patients in the acute and sub-acute phases. Reference values of controls are also shown. Stars indicate a significant difference in patients with respect to the corresponding value in the control group, as indicated by unpaired t-test (*P < 0.05). Horizontal bars indicate significant difference between ILH and CLH values. (B) Scatterplot of the delta band power in ILH and CLH over NIHSS scores at both acute (T0) and sub-acute phase (T1). Regression lines are displayed. (C) Left: Mean (standard error) of band power values in delta band for ILH and CLH in patients in the acute and sub-acute phases, split in two groups on the basis of the lesion site: lesion with cortical involvement, subcortical lesion. Right: Mean (standard error) of inter-hemispheric asymmetries of delta activity at both phases in both groups of patients. Stars indicate a significant difference in patients with respect to the corresponding value in the control group (*P < 0.05), as assessed by Mann-Whitney U test (Bonferroni corrected). (D) Box-plot (median, 95% confidence interval) of CLH delta power in patients at both phases (T0 and T1), stratified in accordance to effective recovery (< 75% and > 75%) and lesion site (cortical involvement, subcortical lesion). ILH: Ipsilesional hemisphere; CLH: contralesional hemisphere; NIHSS: National Institutes of Health Stroke Scale.
