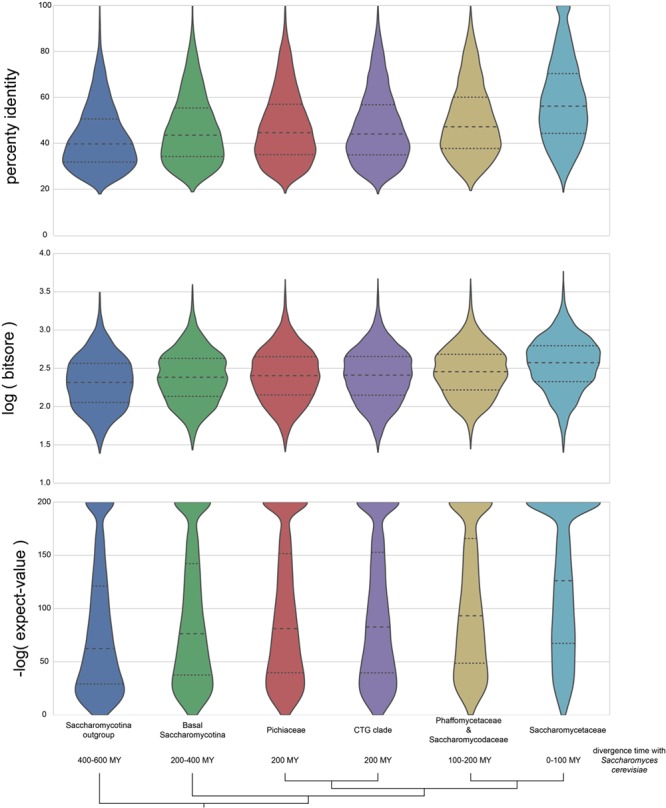
Figure 7.

Distribution of BLASTP percent identities, logarithm of bit scores and negative logarithm of expect values for proteins orthologous to S. cerevisiae. The bottom half of orthologous proteins in the Saccharomycotina outgroup and Saccharomycetaceae has a percent identities of <40% and 58%, respectively; the bottom half of the expect-value ranges is >1e-60 and 1e-125 for the same groups. The wide and skewed distribution in the Saccharomycotina outgroup highlights the difficulty in making pairwise ortholog predictions for proteins with >400 millions of divergence in Dikarya fungi with BLASTP results; however, orthologs can be easily identified in the Saccharomycetaceae family because of their high sequence similarities and low expect values.
