Figure 1.
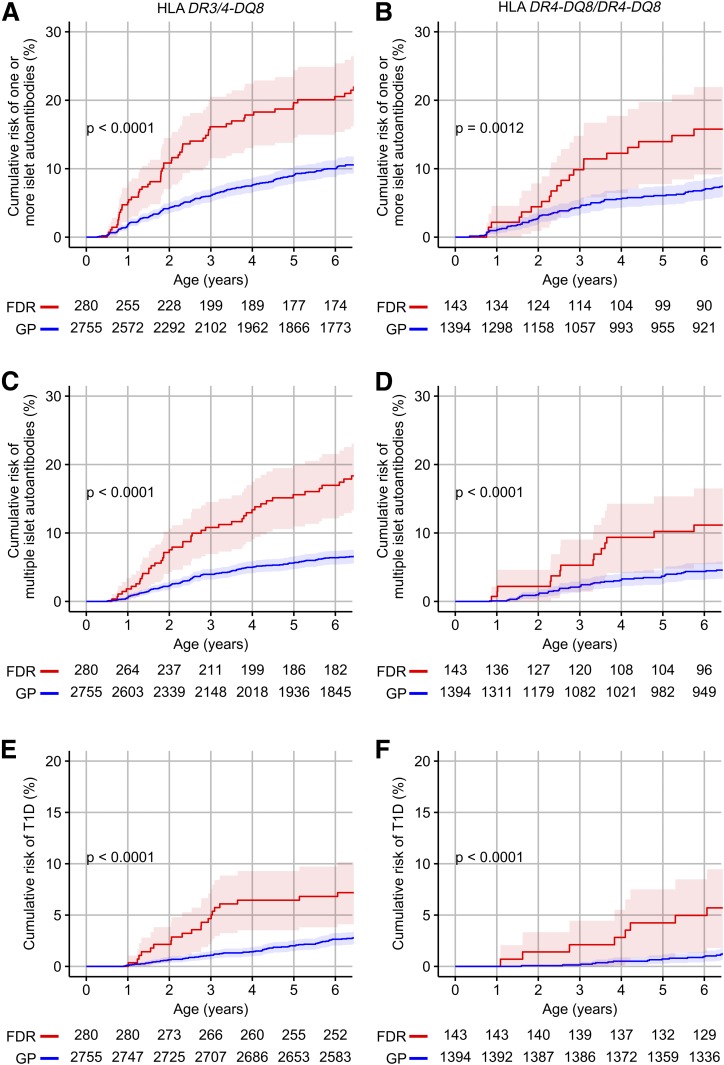
Cumulative risks of islet autoantibodies and diabetes. Kaplan-Meier curves for the risk of one or more islet autoantibodies (A and B), multiple islet autoantibodies (C and D), and diabetes (E and F) in FDR children (red) and in GP children (blue), stratified into children with the HLA DR3/DR4-DQ8 (A, C, and E) or HLA DR4-DQ8/DR4-DQ8 (B, D, and F) genotypes. Shaded areas represent the 95% CI. Numbers represent children at risk. P values were calculated using log-rank tests.

