Figure 2.
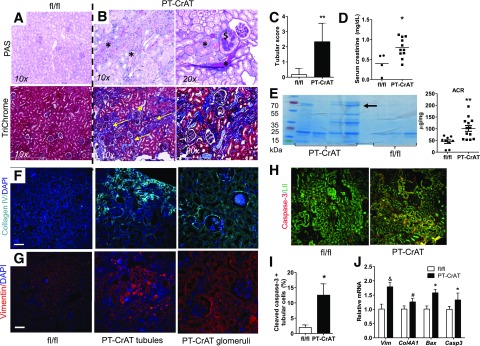
CrAT deletion in PTCs causes kidney disease. A: Representative photomicrographs of PAS and trichrome staining in fixed, paraffin-embedded fl/fl kidneys showing normal histology. B: PT-CrAT kidneys show numerous protein casts in tubular lumen, tubular dilation (*), lipid droplets in tubular cells, trichrome-positive material/fibrosis (yellow arrows), and secondary glomerular disease ($) (≥18 months). C: Tubular injury area was evaluated semiquantitatively, and scores are expressed as minimal 1: <5% of cortex, mild 2: 5–24%, moderate 3: 25–49%, and severe 4: >50% of cortex (n = 6). **P < 0.005. D: Serum creatinine levels in fl/fl and PT-CrAT mice (n = 4–10). *P < 0.05. E: Urine protein analysis by electrophoresis/Coomassie blue staining (arrow points at albumin, ∼67 kDa) in PT-CrAT mice compared with fl/fl controls, with equal amounts of protein (20 μg) loaded and urinary albumin-to-creatinine ratios (ACR) (males, n = 8–12). **P < 0.005. Staining positive for collagen IV (cyan: collagen IV, blue: DAPI) (F) and vimentin (red: vimentin, blue: DAPI) (G) in PT-CrAT tubules and glomeruli. (Photomicrographs are from mice with the highest tubular injury scores.) H: Active caspase-3 staining (red: cleaved caspase-3, green: Lotus tetragonolobus) in fl/fl and PT-CrAT kidneys. Scale bars = 50 μm. I: Percentage of apoptotic PTCs was evaluated by counting cleaved caspase-3–positive, Lotus tetragonolobus counterstained cells (n = 4). *P < 0.05. J: Gene expression analysis in fl/fl and PT-CrAT kidney cortices (n = 6, male mice). *P < 0.05, #P < 0.01, &P < 0.0005 vs. fl/fl.

