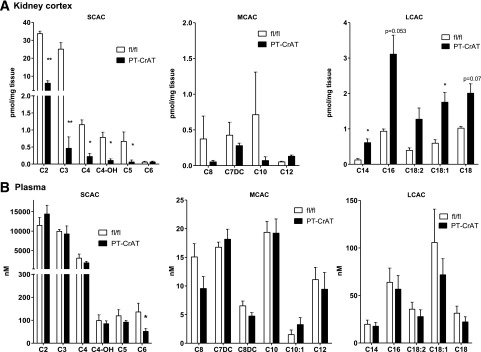
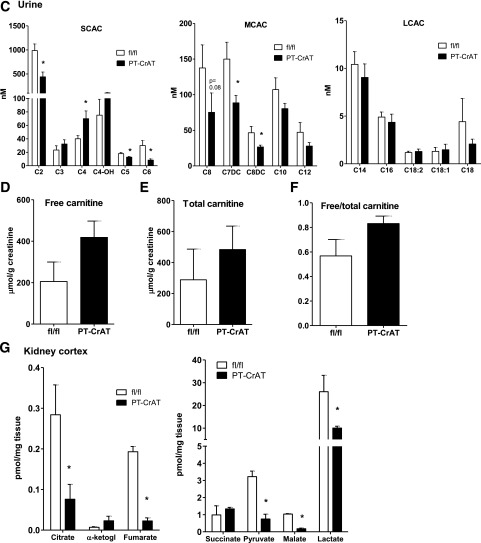
Figure 3.
Altered acylcarnitine and organic acid profiles in the PT-CrAT model. Kidney cortex (A), plasma (B), and urine samples (C) from PT-CrAT mice and fl/fl controls at 18–24 months of age were analyzed by MS/MS for short- (SCAC), medium- (MCAC), and long-chain acylcarnitines (LCAC), as well as free (D) and total carnitine levels (E). MS/MS analysis was normalized to show mice with the strongest kidney injury histology scores. F: Free-to-total carnitine ratios indicating urinary wasting of free carnitine are shown. G: Kidney cortices were analyzed for organic acid intermediates. α-ketogl., α-ketoglutarate. *P < 0.05, **P < 0.005 vs. fl/fl.


