Figure 5.
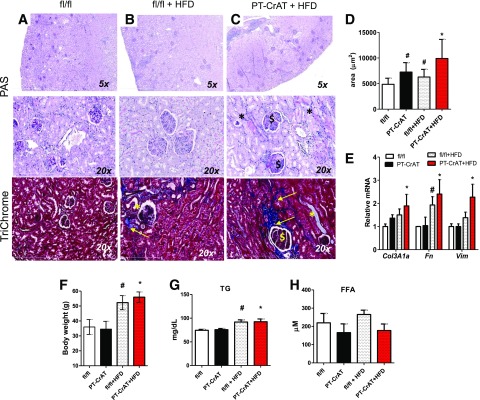
The HFD accelerated kidney disease in the PT-CrAT mice. Representative photomicrographs of PAS- and trichrome-stained kidneys of littermate fl/fl mice showing normal histology (A), fl/fl mice fed the HFD (B), and PT-CrAT mice fed the HFD (C) showing tubular damage (*), fibrosis, and trichrome-positive material (yellow arrows), as well as glomerular sclerosis ($) and glomerulomegalia (12–15 months). D: Glomerular tuft size was measured in each group (n = 30–50 glomeruli per group, at 12 months of age). Gene expression analysis in kidney cortices (E), body weights (F), plasma triglyceride (G), and free fatty acid levels (H) in each experimental group (n = 4–6). #P < 0.05 vs. fl/fl on chow diet, *P < 0.05 vs. PT-CrAT on chow diet.

