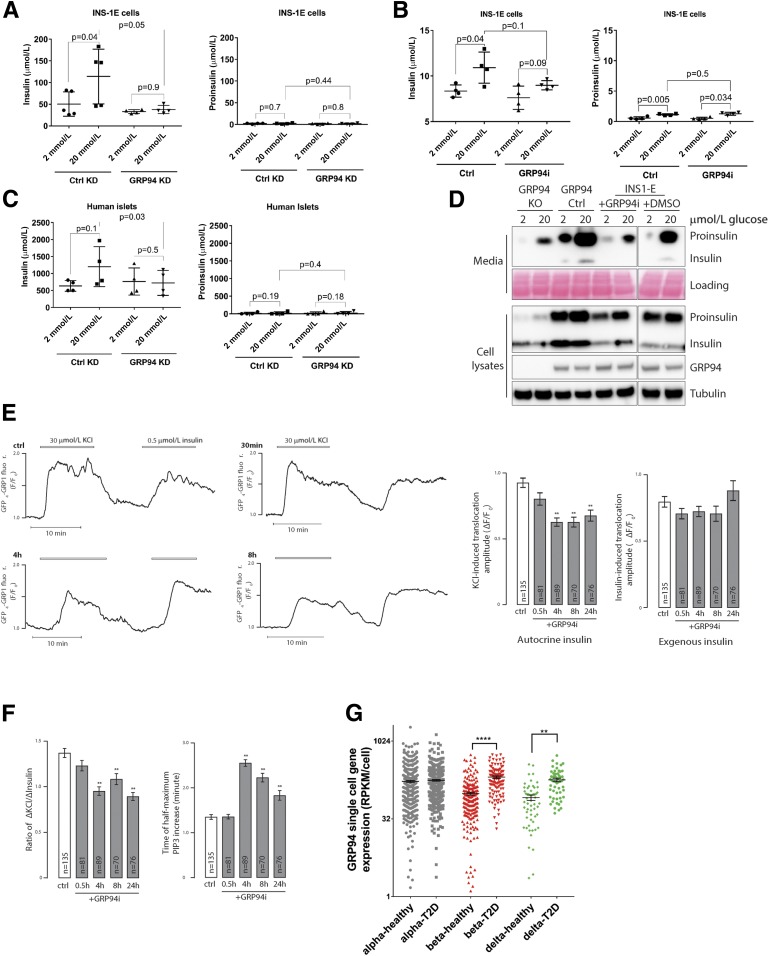
Figure 6.
Glucose-stimulated secretion of bioactive insulin is impaired in GRP94-deficient cells, and GRP94 mRNA is overexpressed in islet cells from patients with T2D. INS-1E control (Ctrl) and GRP94 KD or INS-1E cells exposed to 20 μmol/L of GRP94i for 24 h (A [n = 5] and B [n = 4]) as well as dispersed human islet cells (C) (1 week after transduction with lentivirus carrying nontargeting or GRP94-targeting shRNA coding plasmids; n = 4) were tested for their ability to secrete insulin in response to the given glucose concentrations in Krebs-Ringer bicarbonate HEPES buffer. Supernatants were analyzed by ELISAs specifically detecting mature insulin (A–C, left graphs) or proinsulin (A–C, right graphs) only. The bars represent the means ± SD. D: Accumulated secretion of proinsulin and insulin over the period of 6 h in INS-1E Ctrl and 20 μmol/L GRP94i 24 h pretreated, GRP94 KO Ctrl, and KO cells were analyzed by SDS-PAGE and WB (n = 3). One milliliter of cell supernatants was concentrated using 10-kDa molecular weight cutoff filters to remove salts and reduce volume to 15 μL. E and F: TIRF recordings of PIP3 from a single MIN6 cell stimulated with 30 mmol/L K+ and 0.5 μmol/L insulin. Cells were preincubated without or with 20 μmol/L of the GRP94i for 0.5, 4, or 8 h. F: Means ± SEM of the amplitudes of the PIP3 responses to endogenous K+-triggered insulin secretion (left) and exogenous insulin (right) from experiments as in E with the indicated treatments and numbers of cells. **P < 0.01 for difference from Ctrl (one-way ANOVA with post hoc Tukey honestly significant difference test). Means ± SEM for the ratio of the PIP3 amplitude in response to K+ over that of insulin in individual cells (right). F: Means ± SEM for the time to half-maximal PIP3 increase after K+ stimulation. **P < 0.01 for difference from Ctrl (one-way ANOVA with post hoc Tukey honestly significant difference test). G: Expression levels of GRP94 in dispersed donor human islets α- and β-cells from healthy individuals (n = 6) and patients with T2D (n = 4) were determined by single-cell RNA sequencing and quantified by expression values per cell. Statistical analysis was performed using ANOVA with Bonferroni correction for multiple comparisons of T2D vs. healthy donors. **P < 0.01; ****P < 0.0001.

