
Fig. 5.
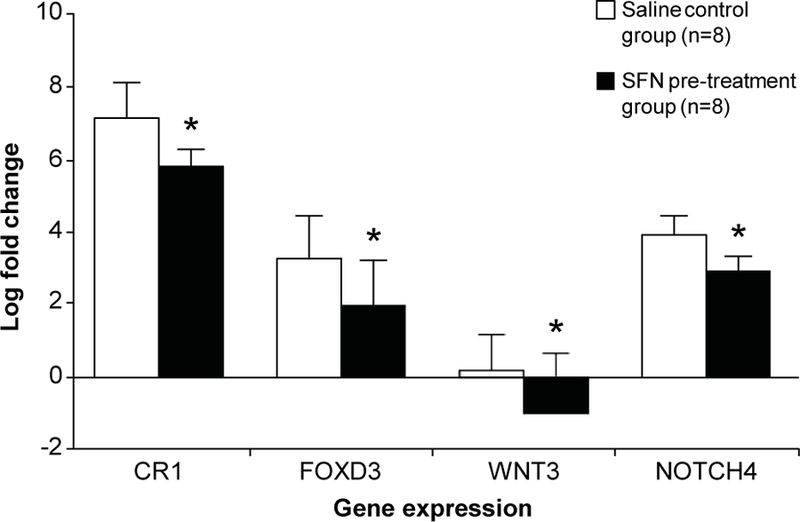
Selected validation of Nanostring gene expression analysis by qRT-PCR. Four genes including CR1, FOXD3, WNT3, and NOTCH4 are shown here as representatives for amplification. Data are the average of 8 samples from SFN pre-treated group and 8 samples from saline control. All experiments were conducted in duplicates. *: P < 0.05 as compared to the control animals.