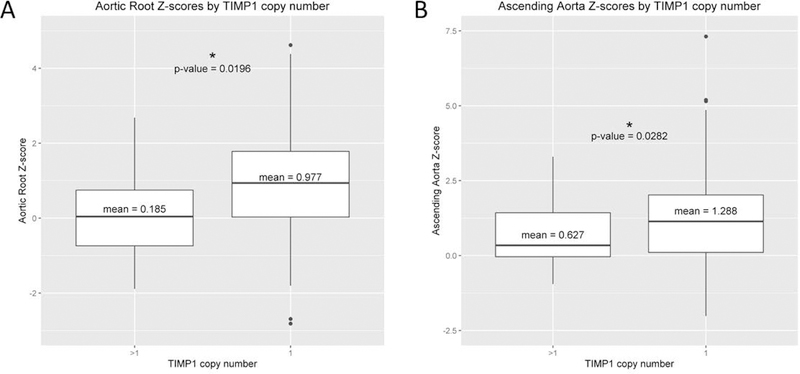
Figure 7. TIMP1 copy number vrs aortic z-scores.
Panel A shows a box plot representing study subject aortic root z-scores plotted against TIMP1 copy number. Panel B shows the box plot for ascending aorta z-scores plotted against TIMP1 copy number. Note that for both aortic root and ascending aorta z-scores there is a significant difference in aortic diameters comparing individuals with only one copy of TIMP1 to those with greater than one copy of TIMP1.

