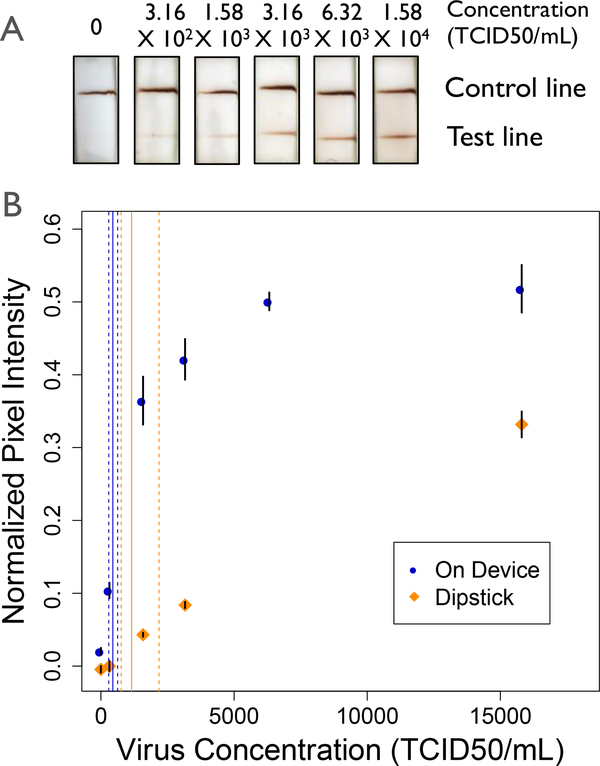
Figure 6.
Limit of detection analysis for the device (blue) and dipstick (orange) assays (A) Representative scans of device test strips. (B) Normalized pixel intensity for the assay run on device and in the dipstick format. The limits of detection were found to be 4.45 × 10² TCID50/mL (95% CI: [2.29 × 102,6.26 × 102]) and 1.15 × 10³ TCID50/mL (95% CI: [7.56 × 10², 2.18 × 10³]) in the on device and dipstick formats respectively. The solid lines indicate the calculated LOD, while the dashed lines indicate the 95% confidence interval. Data points are mean ± standard error, n=6.

