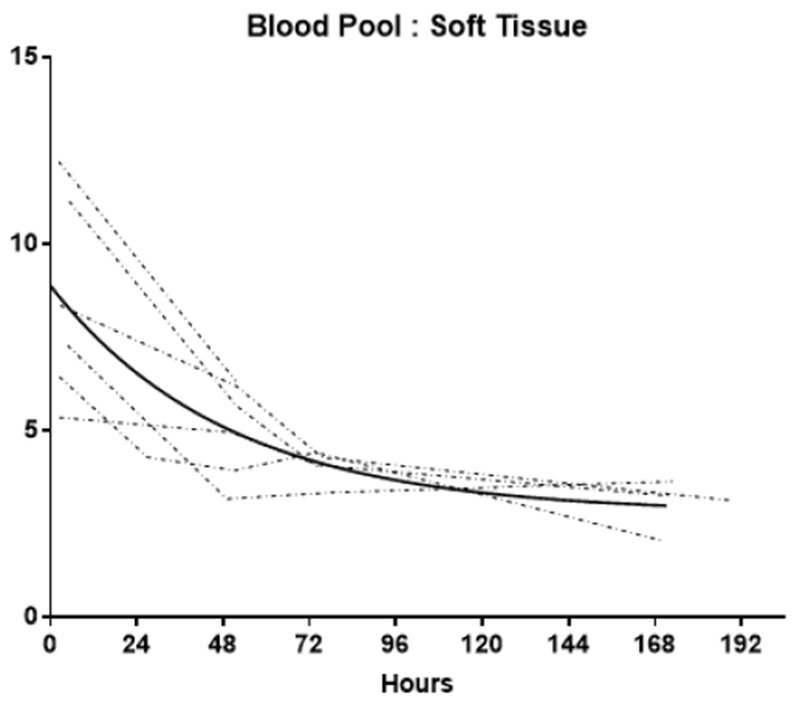
Figure 4A.

Blood pool: Soft tissue ratio (BP:ST) time activity curves (TACs)
Individual TACs of the BP:ST ratios for each patient imaged at multiple time points. The solid line represents the non-linear regression single exponetial fit (GraphPad Prism v7.01). Fit parameters: R2= 0.96; t1/2 = 34.2h [95% Confidence Interval: 25.3 to 46.3h]
