
Figure 4B.
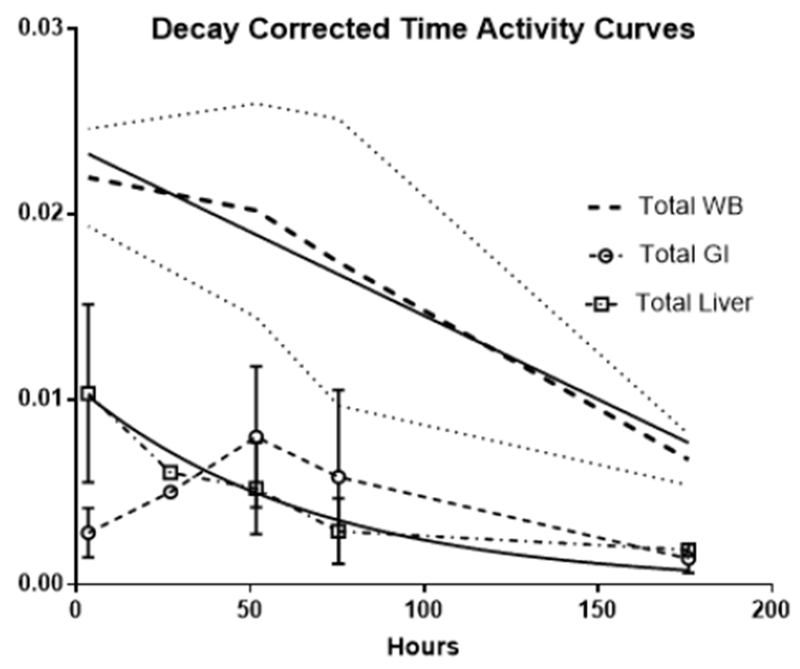
Decay corrected total activity curves
The decay corrected total whole-body (WB) activity over time is depicted by the heavy dashed lines, the thin dotted line on either side are the standard deviation (among patients). The decay corrected total gastrointestinal and liver time-activity curves (TACs) are indicated by the dashed open circles and the dash-dot open squares respectively with the vertical line representing the standard deviation among individual patients’ data. The solid lines are the linear regression fits for the WB and GI and the non-linear regression single decay fit for the liver