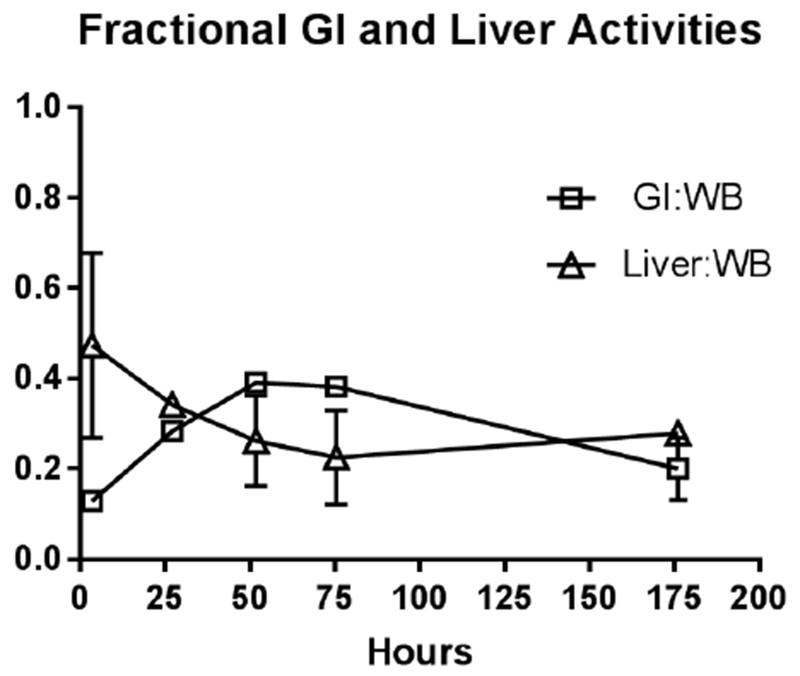
Figure 4C.

Fractional contribution of the liver the GI tract to the decay corrected whole body counts
Average of individual patients’ ratio of decay corrected total GI track and total liver activities to decay corrected WB activity respectively. Vertical bars represent standard deviation (across patients). These are NOT plots of the GI and Liver total activities normalized to the injected dose (found in Figure 4B), but that of fractional contribution of the GI and Liver to Wholebody activity respectively. Comparison of area under the curve (AUC) values show the liver and the GI contribute 50% of the wholebody activity over the entire time imaged. Thin lines indicate the standard deviation of the WB TAC
