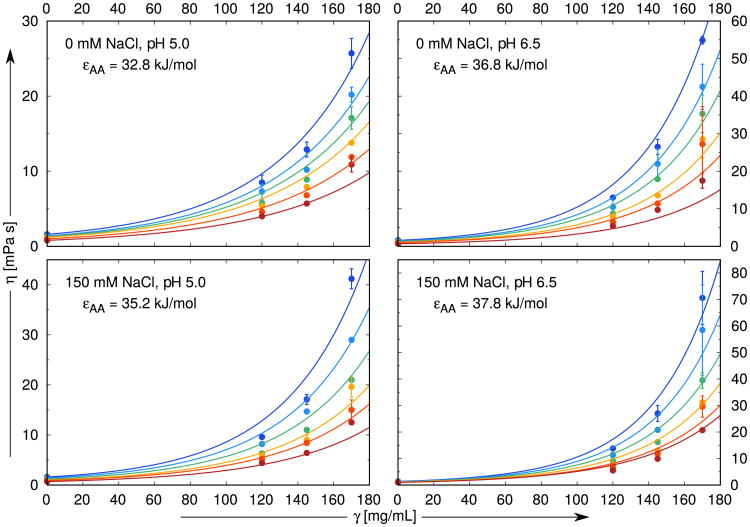
Figure 3.
Comparison of experimental data [34] (symbols) with the results of our model analysis (lines). NaCl concentrations are 0, 50, 100, and 150 mM, pH values studied here 5.0, 5.5, 6.0, 6.5, while the temperatures vary from 10 °C (top–blue) to 35 °C (bottom–red) in increments of 5 °C. The site–site interaction range ω is fixed to 0.18 nm for all calculations, while εAA varies from panel to panel. The data presented here are merely a part of the complete fit shown in Fig. S1.

