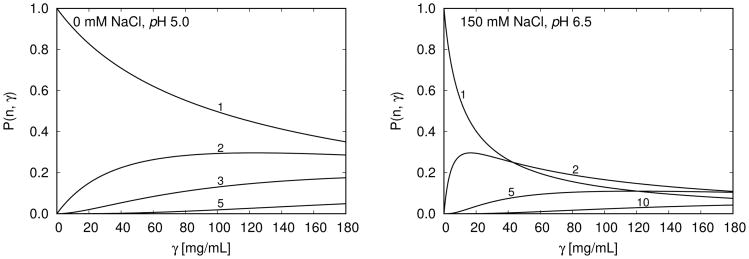
Figure 4.
P(n, γ) for different cluster size n (1 denotes the monomer, 2 dimer, … etc; up to decamer denoted by 10) as a function of the protein mass concentration γ at 10 °C. (i) Left panel shows the low viscosity trends – no salt present, pH = 5.0, and (ii) the right panel presents the high viscosity trends – concentration of added NaCl is 150 mM, pH = 6.5; see also Fig. 3.

