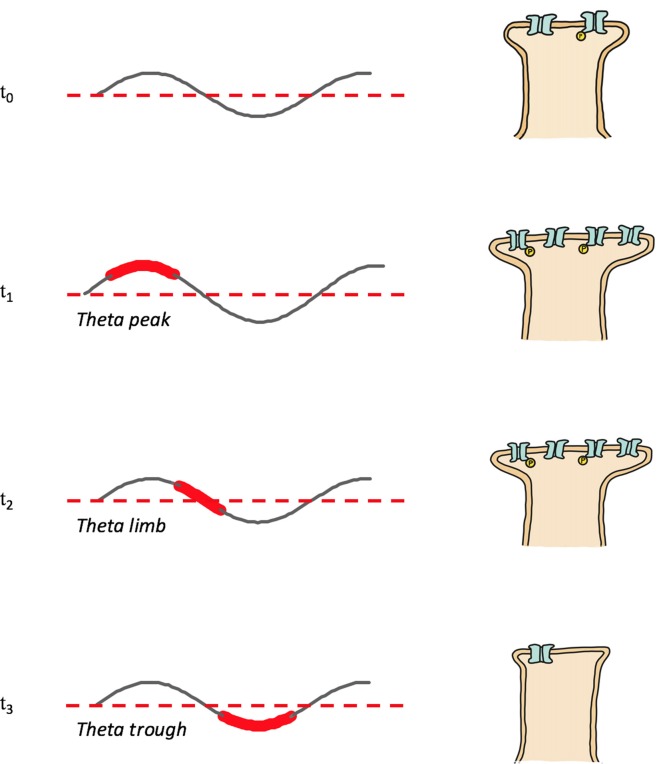
Figure 2.
Memory replay during REMS theta shifts phases with increasing memory familiarity. Depicted are theta rhythms, theta replay phases (shown widened and in red) and synapse strengths following theta phase specific reactivations; synapse strength is represented by the size of the postsynapse as well as by the number and phosphorylation (yellow “P”) status of receptors. T0: post-encoding/pre-REMS and starting memory synapse strength; T1: theta peak replay and synapse potentiation; T2: theta limb replay, maintenance phase with no net change of synapse strength; T3: theta trough replay and depotentiation.

