. 2019 Jan 4;8(2):227–237. doi: 10.1039/c8tx00194d

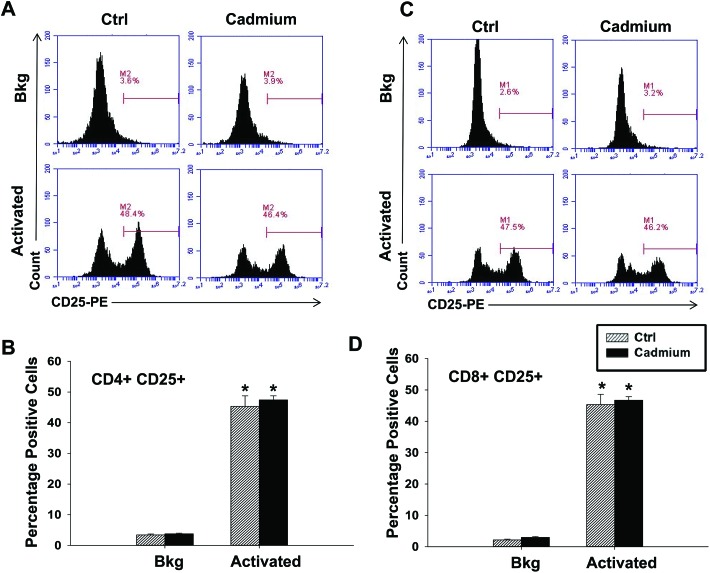
Fig. 5. Cadmium exposure has little impact on the cell surface marker expression 24 h after T cell activation. Splenocytes from the control (Ctrl) or cadmium-exposed rats were left untreated (Bkg) or activated with plate bound αCD3 and soluble αCD28. Cells were collected 24 h after activation and labeled with fluorochrome-conjugated antibodies against CD4, CD8, and CD25 prior to FACS acquisition and analysis. (A and C) Representative histogram plots gated on (A) CD4+ cells or (C) CD8a+ cells. (B, D) Quantification of CD25 expression in the (B) CD4+ and (D) CD8a+ populations. Data are presented as mean ± SE. * indicates P < 0.05 between Bkg and activated splenocytes for the same rat in vivo exposure group.

Fig. 5