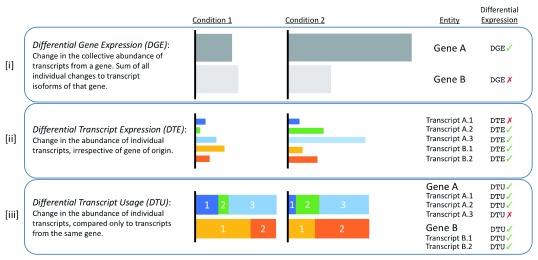
Figure 1. Illustrative definitions of the three types of differential expression analysis (DGE, DTE and DTU).
The expression of two genes (Gene A and Gene B), with 3 and 2 isoforms respectively, is compared across two conditions (Condition 1 and Condition 2). The horizontal width of each coloured box represents the abundance of the relevant gene or transcript. A negative differential expression result (red cross-mark) for a given entity in any one of the three analysis types does not exclude that same entity from having a positive result (green tick-mark) in one of the other two analysis types. The relative isoform abundances in [ iii] are scaled to the absolute isoform abundances in [ ii], which in turn are scaled to the gene expressions in [ i]. Gene A is differentially expressed, but only two of its three isoforms are differentially expressed (A.2 and A.3). Proportionally, Gene A’s primary isoform (A.3) remains the same, but the ratios of the two less abundant isoforms change. Gene B is not differentially expressed, but both its isoforms are differentially expressed, and demonstrate an example of isoform switching. DGE: Differential gene expression, DTE: Differential transcript expression, DTU: Differential transcript usage.

