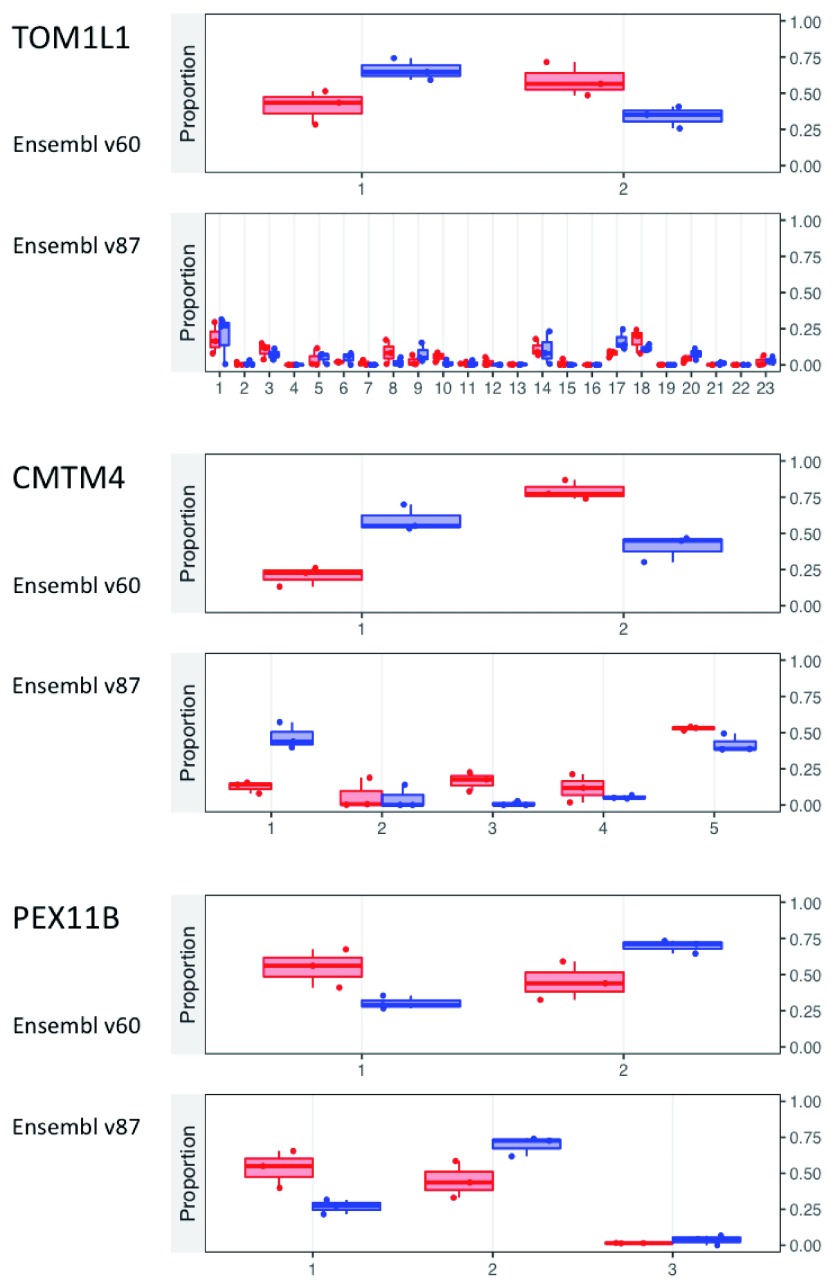
Figure 4. Relative abundance of isoforms for the three validated genes from 31, as re-quantified with Salmon 0.7.1 14 using two versions of the Ensembl annotation.
Isoform IDs on the x axis were replaced with simple numbers to minimize clutter, but the mapping of number to ID is maintained between the two annotations. The y axis represents the relative abundance of each isoform. In red are the quantifications from the three replicates of the Control condition, and in blue are those from the IPF condition. The full version of the plots by RATs, including the full isoform IDs, is available in Extended data 5 33.

