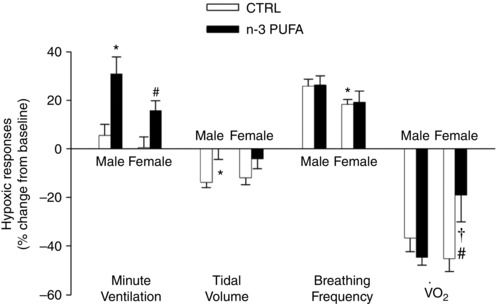
Figure 6. Sex‐specific effects of n‐3 PUFA supplementation on minute ventilation, tidal volume, breathing frequency responses to hypoxia and O2 consumption in pups (P10–11).

All variables were measured during normoxia (baseline) and following 20 min of exposure to moderate hypoxia (12% CO2). Histograms represent responses expressed as a percentage change from baseline and are compared between groups: pups that received n‐3 PUFA supplementation (black bar) and controls (white bar). Data are expressed as the mean ± SEM. The ANOVA results reported are for the entire data set. The number of replicates in each group is reported in Table 2. Post hoc pairwise comparisons were performed only when warranted by ANOVA. Significantly different from male CTRL group: * P ≤ 0.05. Significantly different from female CTRL group: # P ≤ 0.05. Significantly different from male n‐3 PUFA: † P ≤ 0.05.
