
Figure 7. Effects of n‐3 PUFA supplementation on anapyrexia response to hypoxia.
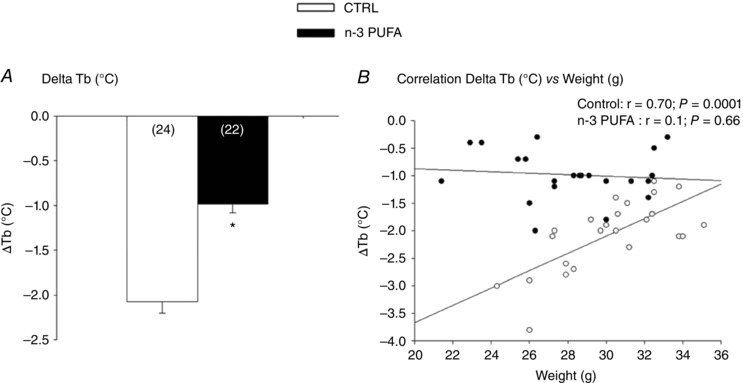
A, comparison of the decrease in T b° (body temperature) between n ‐3 PUFA supplemented and control (CTRL) pups. B, comparison of the relationship between ΔT b° and body weight in n ‐3 PUFA supplemented and control pups. Histograms represent responses expressed as the mean ± SEM; numbers in brackets indicate the number of pups per group. Males and females were analysed together because there was no sex‐specific difference for this variable. Significantly different from CTRL group: * P ≤ 0.05.