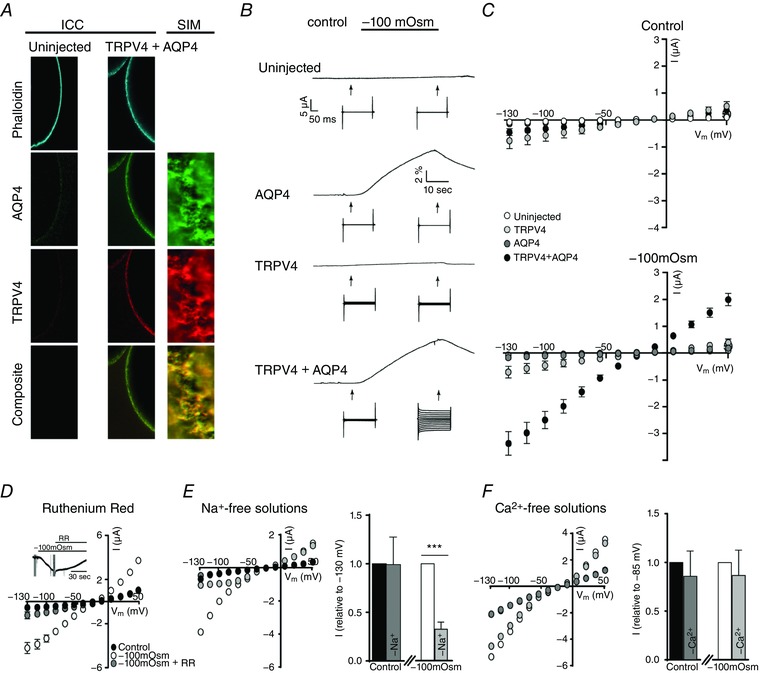
Figure 1. TRPV4 is activated by increased cell volume.

A, representative confocal laser scanning and structured illumination microscopy of an uninjected oocyte (left) and an oocyte expressing TRPV4 + AQP4 (right) after immunolabelling with phalloidin, anti‐AQP4 and anti‐TRPV4 antibodies confirmed the plasma membrane expression and close relationship of the proteins in oocytes. B, representative volume‐ and current traces obtained from oocytes voltage clamped at V m = −20 mV and challenged with a hyposmotic gradient (−100 mosmol l–1, indicated by a black bar). Current traces were recorded with a 200 ms step protocol (when indicated by an arrow) from an uninjected oocyte (top) and oocytes expressing either AQP4 (middle), TRPV4 (middle) or TRPV4 + AQP4 (bottom). C, summarized I/V curves from uninjected oocytes and oocytes expressing either AQP4, TRPV4, or TRPV4 + AQP4 in control solution (top) or during application of a hyposmotic solution (bottom; −100 mosmol l–1). D, application of ruthenium red (4 μm, 60 s) blocked the volume‐induced current activity of TRPV4 + AQP4‐expressing oocytes (summarized I/V curves) as seen in the representative current trace (D, insert). E, representative I/V curves obtained from a TRPV4 + AQP4 expressing oocyte exposed to regular and Na+‐free solutions (symbol colours correspond to the bar graph, right). The bar graph illustrates the current activity obtained in Na+‐free solutions (control and hyposmotic solutions) normalized to that recorded in regular solutions (control and hyposmotic solutions) at V m = −130 mV, n = 8–10) (E, bar graph). F, representative I/V curves obtained from a TRPV4 + AQP4 expressing oocyte exposed to regular and Ca2+‐free solutions (symbol colours correspond to the bar graph, right). The bar graph illustrates the current activity obtained in Ca2+‐free solutions (control and hyposmotic solutions) normalized to that recorded in regular solutions (control and hyposmotic solutions) at V m = −85 mV, n = 10) (F, bar graph). The magnitudes of TRPV4‐mediated currents (at V m = −85 mV) were compared using one‐way ANOVA with Dunnett's multiple comparison post hoc test or a Student's paired t‐test (for the normalized response). *** P < 0.001 (n = 8–25). [Color figure can be viewed at wileyonlinelibrary.com]
