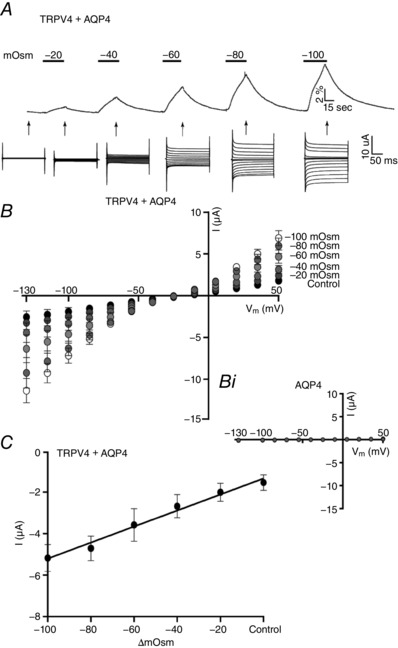
Figure 3. Effects of osmotic load on TRPV4 activation.

A, volume and current traces (recorded after 30 s of exposure to the given osmotic gradient, indicated by arrows) from a TRPV4 + AQP4‐expressing oocyte challenged with increasing osmotic gradients (−20 to −100 mosmol l–1, indicated by black bars). B, summarized I/V curves of TRPV4 + AQP4‐expressing oocytes exposed to increased osmotic loads, n = 9 (with the I/V curves of AQP4‐expressing oocytes given as (Bi)) (n = 9). C, summarized TRPV4‐mediated activity plotted as a function of the applied osmotic challenge (at V m = −85 mV, r 2 = 0.9493, n = 9).
