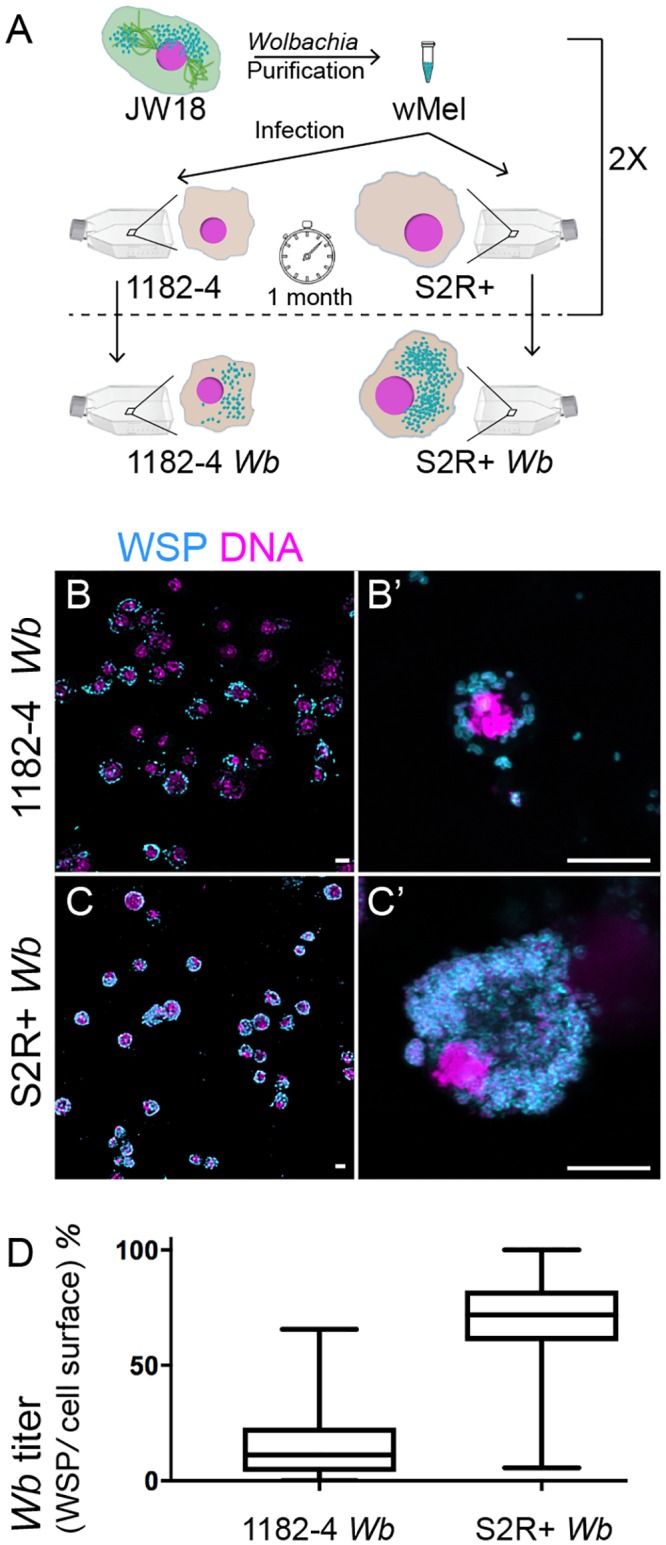
Fig 1. Influence of the genetic background of Drosophila cell lines on Wolbachia wMel titers.

(A) Summary of the experimental approach to infect 1182–4 and S2R+ cell lines. See Materials and methods. (B to C') Confocal acquisitions of infected cell lines immunostained with an anti-WSP decorating the Wolbachia surface in cyan, DAPI is in magenta. (B') and (C') are higher magnifications showing individual cells corresponding to Supplemental movies 1 and 2. Scale bar = 10 microns. (D) Box plot graphs of wMel normalized titers in 1182–4 Wb and S2R+ Wb, expressed as a percentage of fluorescence surface associated with the anti-WSP staining per cell surface area (n = 181 and median = 11% for 1182–4 Wb, and n = 215 and median = 71% for S2R+ Wb).
