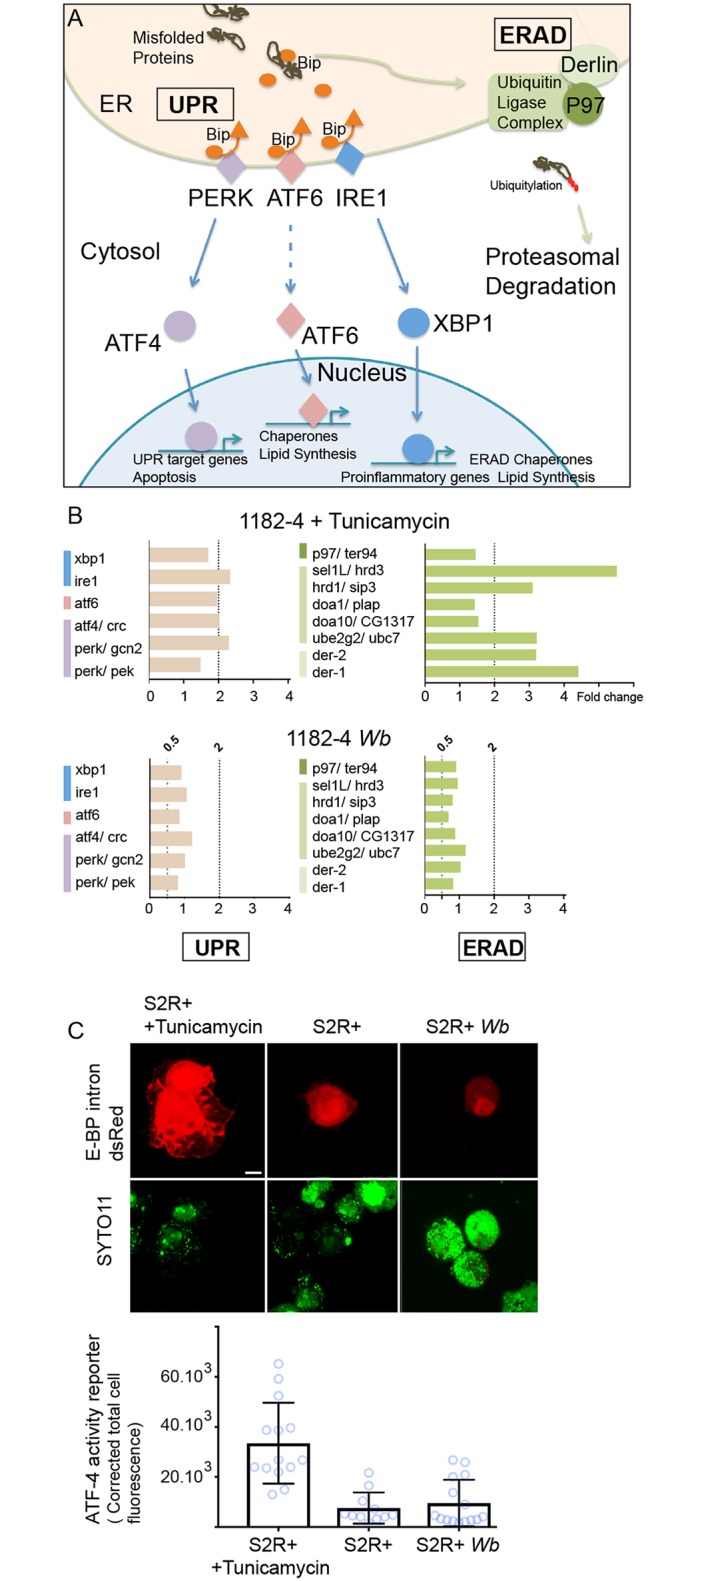
Fig 6. Wolbachia do not induce induce ER stress.

(A) Schematic summary of the UPR and ERAD pathways. The color code highlights the three UPR pathways and the ERAD and is identical to what employed in (B). (B) Genes tested by quantitative PCR, in presence of tunicamycin -top graphs-, or Wolbachia -bottom graphs-. UPR genes are on the left and ERAD genes on the right. Gene expression fold changes are represented, and variations comprised between a 2-fold increased expression -"2" above the dashed line- and a 2-fold decreased expression—"0.5" are considered insignificant. (C) S2R+ cells transfected with the ATF4 activity reporter E-BP intron dsRed; after a 48hr-long treatment with tunicamycin at 10 μg/mL, or in presence of Wb. DNA is stained with SYTO-11 -green-. In absence of Wb, nuclei incorporate the dye at various levels, while in presence of Wb, the dye stains preferentially the endosymbionts compared to the nuclei, highlighted with a red dashed line. Two adjacent transfected cells are shown in presence of tunicamycin, and only one for S2R+ and S2R+ Wb. The graph represents quantifications of the dsRed fluorescence levels in each conditions. For S2R+ n = 14; S2R+ with tunicamycin n = 11; and for S2R+ Wb n = 15.
