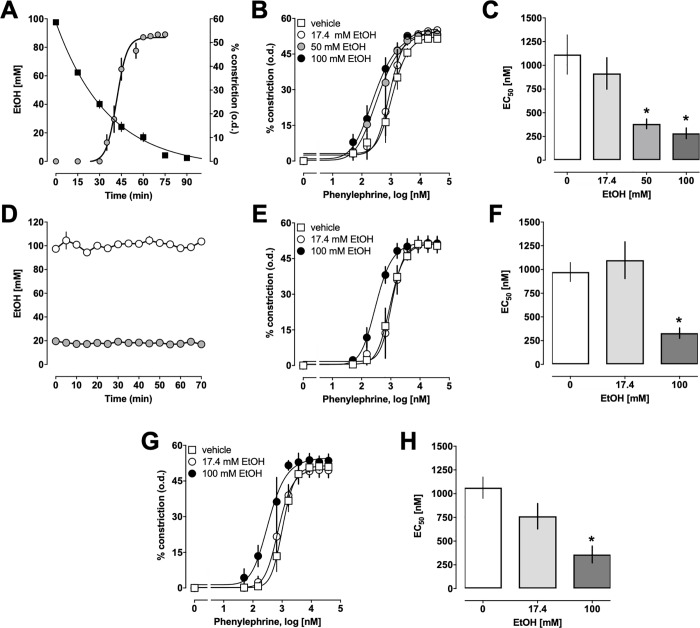
Fig 1. Effects of ethanol (EtOH) on phenylephrine-induced constriction of mesenteric resistance arteries.
Data are mean ± SEM. A. EtOH concentrations in the vessel bath during pressure myography experiments. Arteries were pressurized to 80 mmHg, pretreated for 30 min with a single dose of 100 mM EtOH and exposed to increasing doses of phenylephrine (PE). Squares: EtOH concentrations (mM) in the vessel bath, n = 3–5. Circles: Vasoconstriction in % of the outer diameter (o.d.) in response to increasing doses of PE (n = 5). B. PE-induced constriction in % of the o.d. in arteries pretreated with single doses of EtOH for 30 min, as in A. Vehicle—n = 5; 17.4 mM EtOH–n = 3; 50 mM EtOH–n = 5; 100 mM EtOH–n = 5. C. EC50 concentrations for the vasoconstrictor effects of PE (mM) from dose-response curves in B. *: p<0.05 vs. vehicle. D. Ethanol concentrations (open circles: 100 mM EtOH; grey circles: 17.4 mM EtOH) were measured in 5 min intervals and maintained constant by adding ethanol to the vessel bath to account for evaporative losses. N = 3. E. PE-induced constriction in % of the o.d. in arteries pretreated with constant concentrations of EtOH for 30 min. Vehicle–n = 5; 17.4 mM EtOH–n = 3; 100 mM EtOH–n = 4. F. EC50 concentrations for the vasoconstrictor effects of PE (mM) from dose-response curves in E. *: p<0.05 vs. vehicle. G. PE-induced constriction in % of the o.d. in arteries pretreated with constant concentrations of EtOH for 60 min. Vehicle–n = 3; 17.4 mM EtOH–n = 3; 100 mM EtOH–n = 3. H. EC50 concentrations for the vasoconstrictor effects of PE (mM) from dose-response curves in G. *: p<0.05 vs. vehicle.

