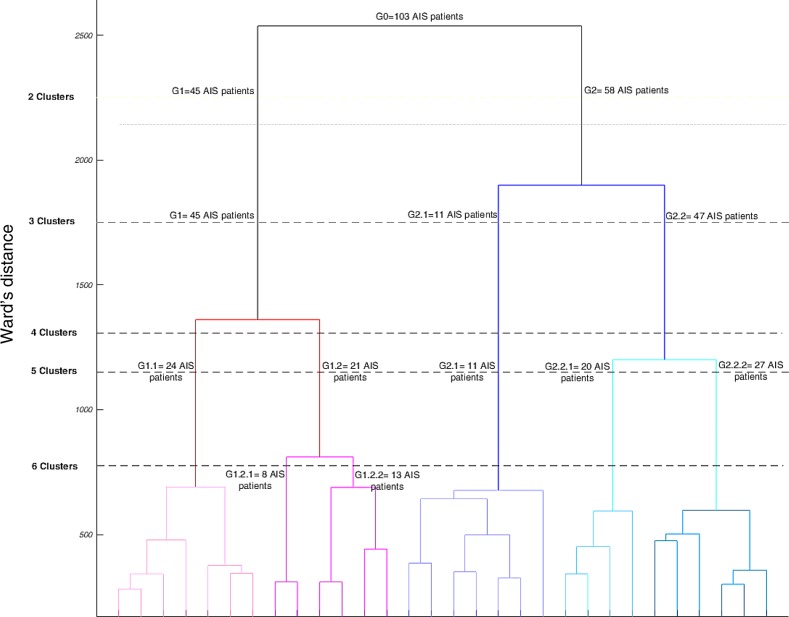
Fig 2. The dendrogram of the AIS patients hierarchical classification (n0 = 103).
The Y-axis shows the Ward’s distances at which the increase in within cluster variance remains minimum after merging two groups. The number of patients in each cluster at different Ward’s distances are shown. At the highest cutoff point two clusters of G1 = 45 patients and G2 = 58 patients were identified. At Ward’s distance = 1700, two subgroups of G2, G2.1 = 11, G2.2 = 47 were identified. At Ward’s distance = 1320, two subgroups of G1 are shown (G1.1 = 24, G1.2 = 21). Finally, at Ward’s distance = 1125, G2.2 subgroups (G2.2.1 = 20, G2.2.2 = 27) were shown. The two subgroups of G1.2 (G1.2.1 = 8, G1.2.2 = 13), as shown at Ward’s distance = 790, were not visually different (supplementary data- S1 Fig).

