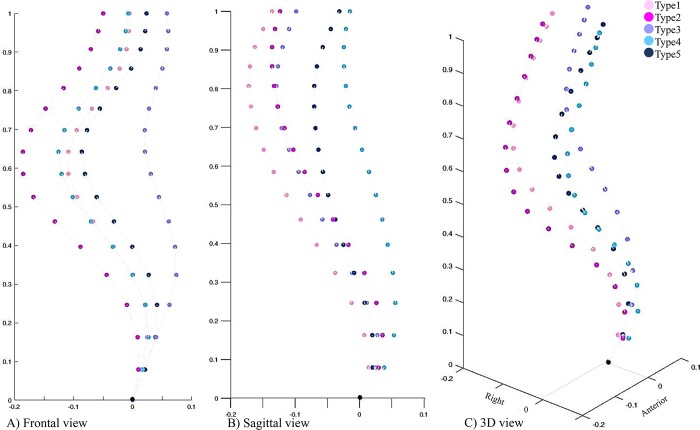
Fig 4.
The final 5 clusters A) frontal, B) sagittal and C) 3D views are superimposed. Frontal view is comparable between G1.1, G2.2.1, G2.2.2 when compared to either G1.2 or G2.1 (Fig 4A). The sagittal profile was more comparable between G1.1, G1.2, G2.1 compared to either G2.2.2 or G2.2.1 (Fig 4B). In 3D, two main clusters (G1s and G2s) were identifiable (Fig 4C). The colors and groups names matches the clusters in Figs 2 and 3.

