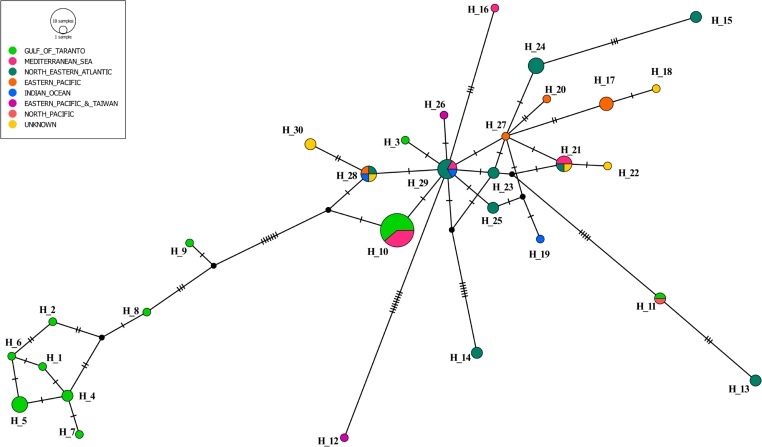
Fig 2. Median-joining network of cytochrome b haplotypes from S. coeruleoalba.
Circle size is proportional to the number of individuals exhibiting that haplotype (H_1 represents a single animal and H_10 represents 18 animals). Colours indicate the geographic origin of the samples. Mutation events separating haplotypes are indicated as "hatch marks". Black circles indicate missing, intermediate haplotypes.

