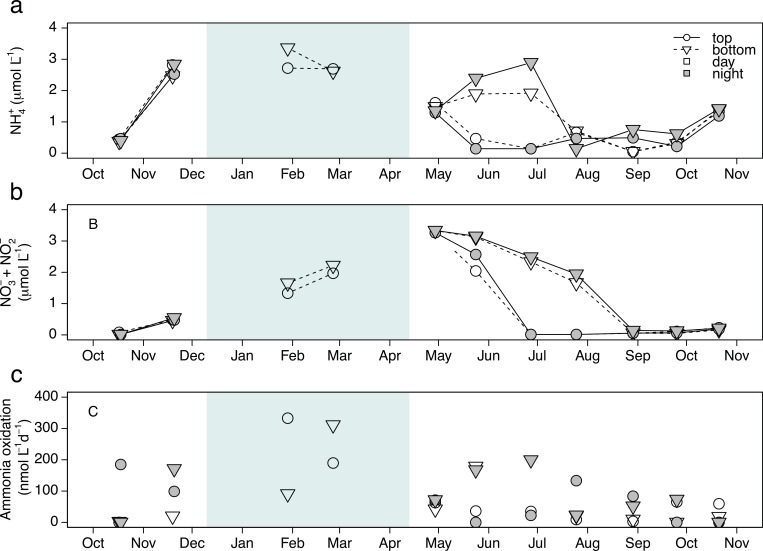
Fig 2.
Temporal variation of ammonium concentrations (NH4+, μmol L-1) in (a), nitrate + nitrite concentrations (NO3- + NO2-, μmol L-1) in (b), and ammonia oxidation rates (AO, nmol L-1day-1) in (c) at both depths sampled and during day and night. Top and bottom refer to the depth where 10% and 1% of the incident light was measured during the day. The period where the lake was covered by ice is depicted by a light blue rectangle.

