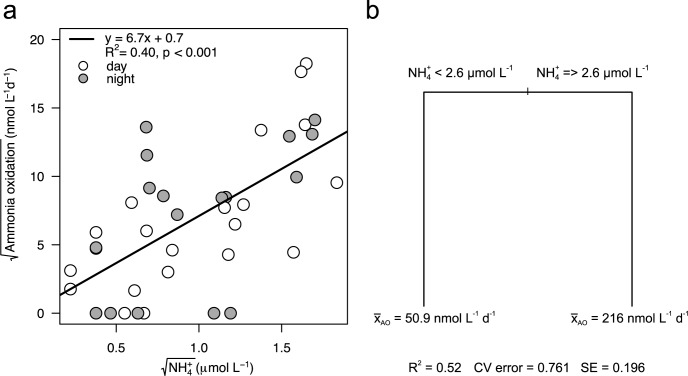
Fig 4.
Relationships between ammonium (NH4+) concentrations and ammonia oxidation (AO) rates using (a) ordinary least square regression and (b) univariate regression tree (URT). In a) grey circles are night samples and white circles day samples. In b) the split is labeled with the variable and the concentration that determines the split. Each node is labeled with the mean rating and the number of sites in the group.

